Full Report
The numbers behind PT Cahaya Aero Services Tbk (formerly PT Cardig Aero Services Tbk): as-reported financial statements and company metrics for FY2021–FY2025, traced to the source filings, opened with the share-price history those statements have to justify. Every linked figure opens the exact page of the filing it was printed on, with the statement row highlighted. Amounts in Rp millions unless noted.
Reading notes: All figures in millions of Rupiah, exactly as printed in the audited consolidated financial statements ('Expressed in millions of Rupiah'). Per-share amounts are in full Rupiah. Net income shown is profit attributable to owners of the parent (the basis used by the data feed); 'Profit for the year' above it is the total including non-controlling interests, which take a large share (NCI is the listed subsidiary PT Jasa Angkasa Semesta). Segment reporting changed in 2025: FY2021–FY2024 reports disaggregate revenue into four service-line segments (Ground and Cargo Handling, Aircraft Release and Maintenance, Catering, Aviation Training); from FY2025 the company reports two divisions (Aviation vs Non-Aviation). The hero 'Revenue by Operating Division' uses the current Aviation/Non-Aviation basis (FY2024–FY2025, from the FY2025 report); the 'Revenue by Service Line' table preserves the FY2021–FY2024 detail. Facility Management Services was reported as a separate revenue segment only in FY2021–FY2022; it does not appear in the FY2023–FY2024 four-segment note.
Share Price — Available History Since January 2026
The stock closed at IDR 1,890 on Jul 30, 2026 — down 20% over the window shown, trading between IDR 1,700 and IDR 2,550.
Source: market price feed, daily closes, Jan 2026–Jul 2026 — the feed marks this available history as partial. Price return only, excludes dividends.
FY2025 at a Glance
Revenue (Rp millions)
Operating income (Rp millions)
Net income (Rp millions)
Source: FY2025 consolidated statements [1] [2] [3] [4]. Click any linked figure to open the filing page with the row highlighted.
Revenue by Operating Division
| Revenue by Operating Division | FY2021 | FY2022 | FY2023 | FY2024 | FY2025 |
|---|---|---|---|---|---|
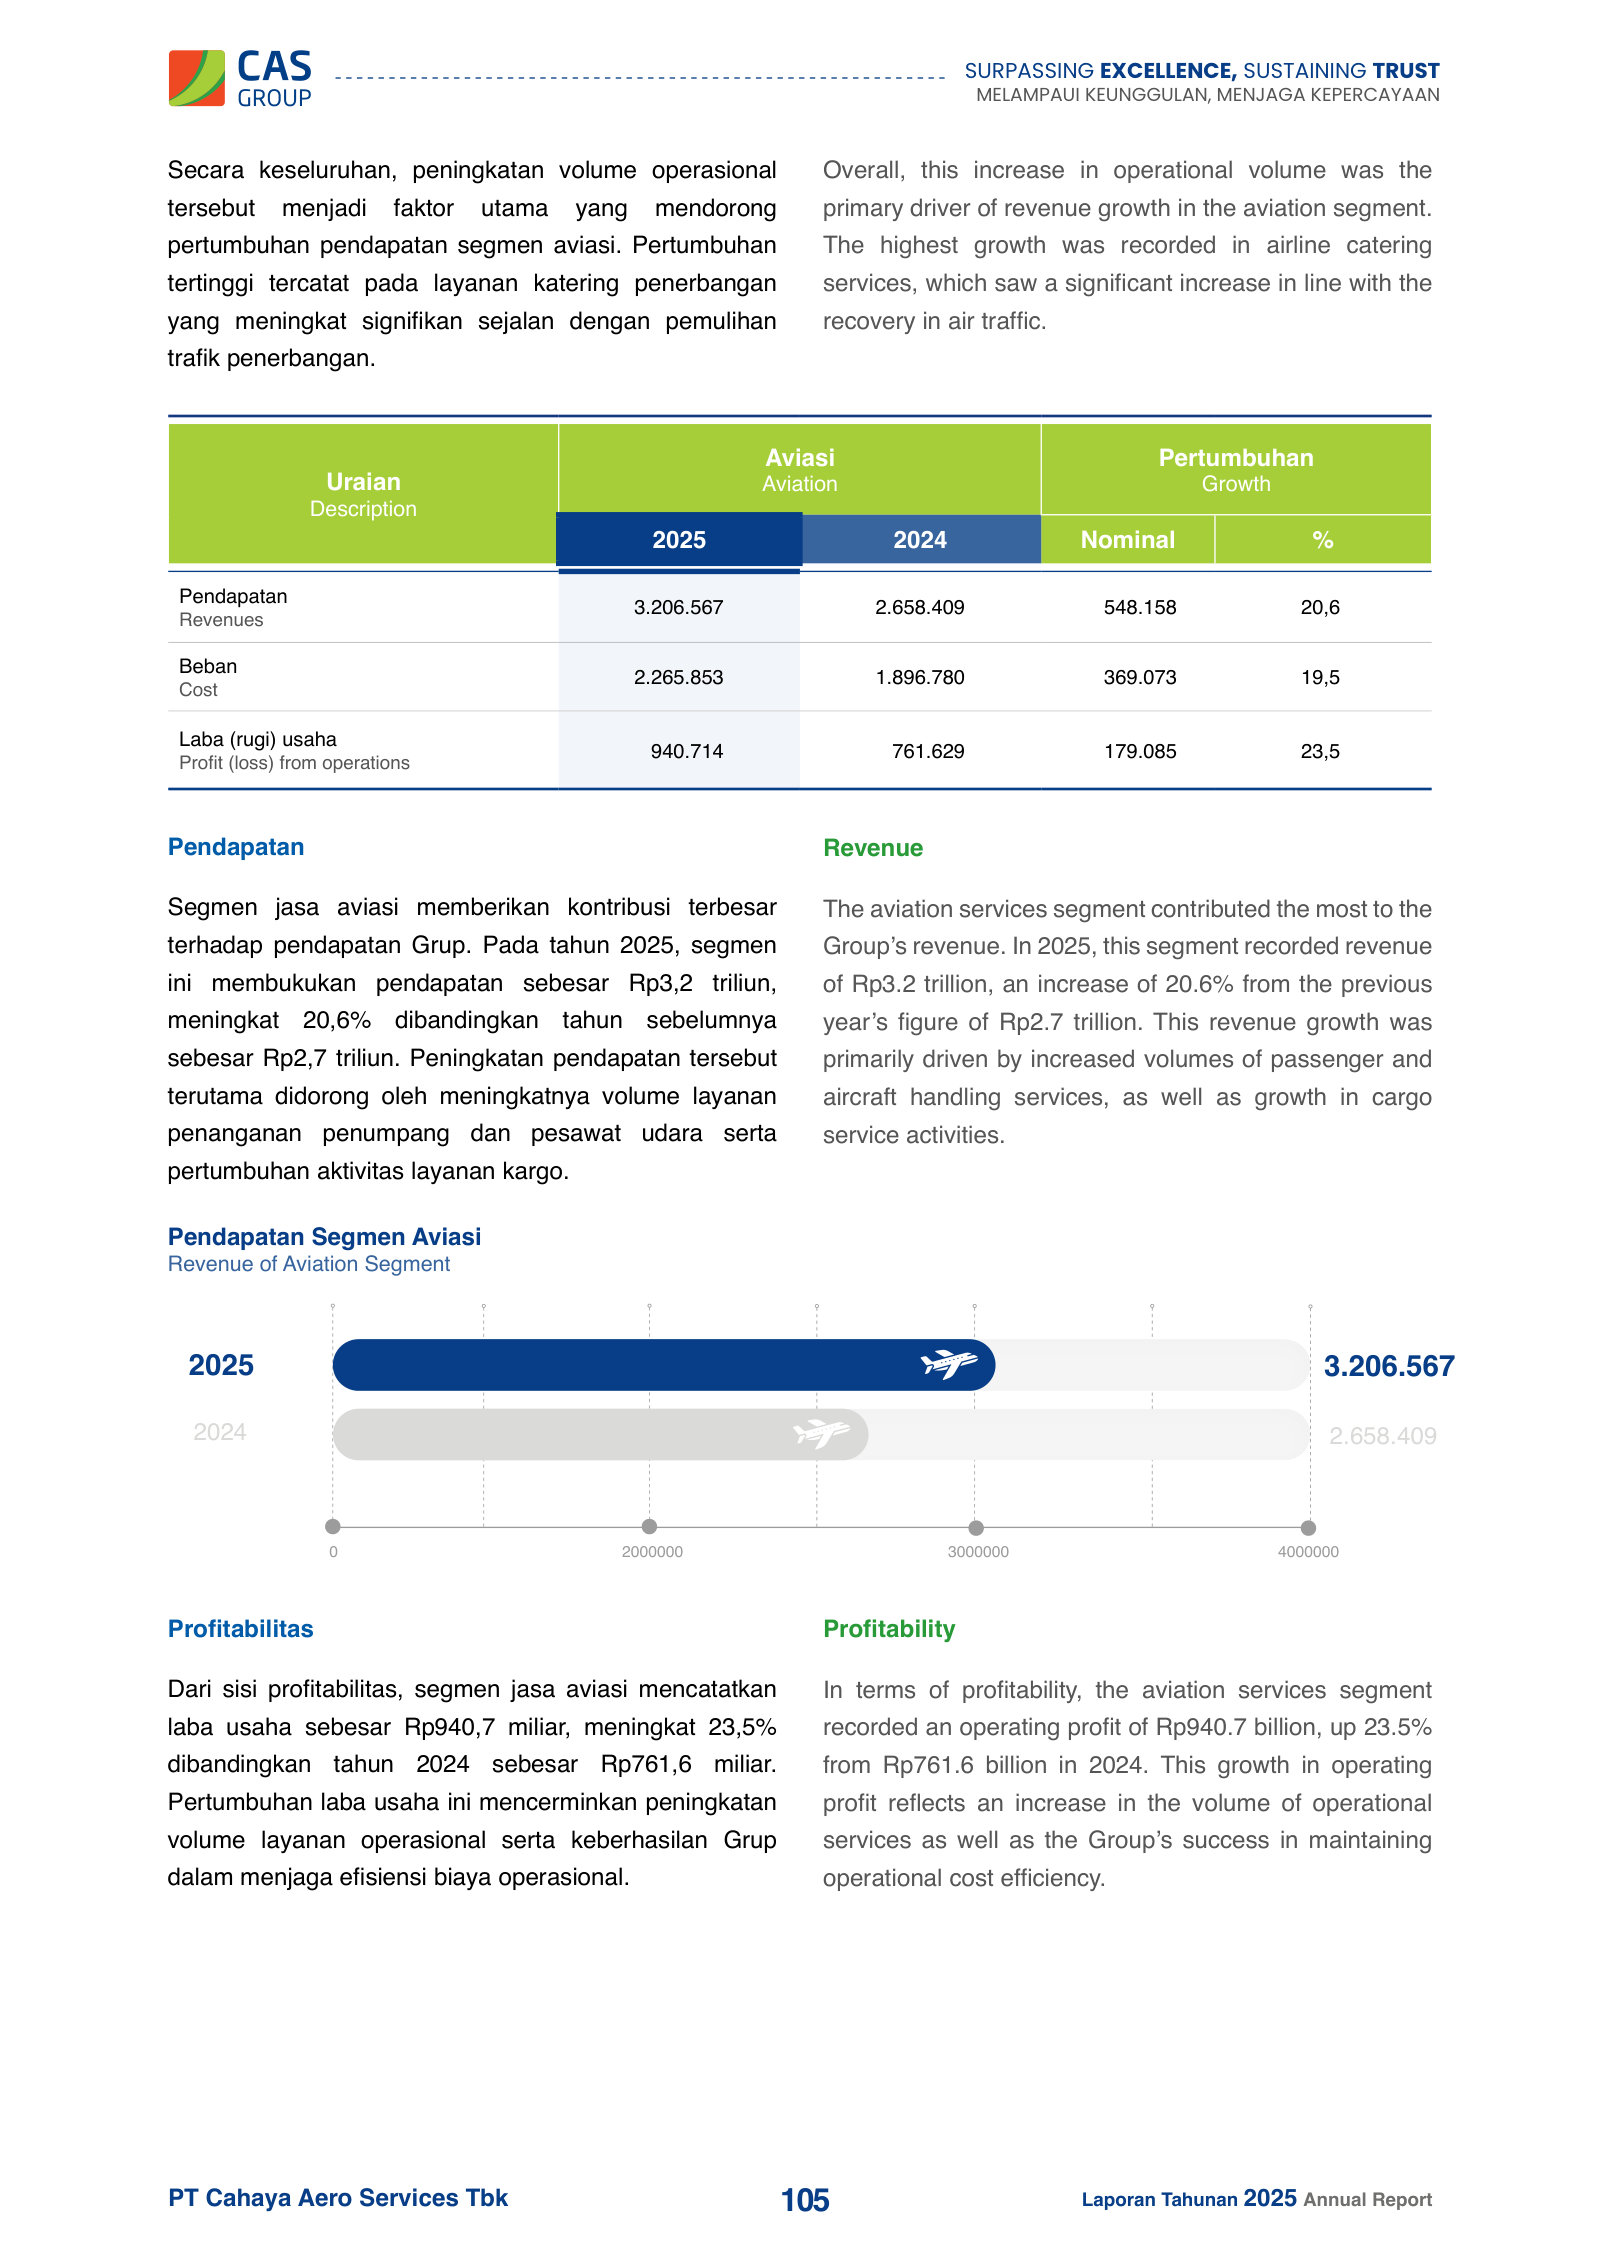
| Aviation Services | — | — | — | 2,658,409 | 3,206,567 |
| Non-Aviation Services | — | — | — | 165,521 | 168,571 |
| Eliminations | — | — | — | (85,443) | (119,618) |
| Total revenue | 1,407,396 | 1,737,746 | 2,199,217 | 2,738,487 | 3,255,520 |
| Total revenue growth, derived | — | +23.5% | +26.6% | +24.5% | +18.9% |
Source: Segment Information note (Note 32), FY2025 Annual Report — Aviation vs Non-Aviation basis adopted in 2025 [5] [6] [2] [4]. Click any linked figure to open the filing page with the row highlighted.
Income Statement
| Income Statement | FY2021 | FY2022 | FY2023 | FY2024 | FY2025 |
|---|---|---|---|---|---|
| Revenues from contracts with customers | 1,407,396 | 1,737,746 | 2,199,217 | 2,738,487 | 3,255,520 |
| Operating expenses | (1,167,794) | (1,337,449) | (1,650,665) | (1,947,427) | (2,296,322) |
| Profit from operations | 239,602 | 400,297 | 548,552 | 791,060 | 959,198 |
| Finance income | 66,101 | 61,020 | 62,124 | 57,471 | 86,209 |
| Finance cost | (29,027) | (16,300) | (12,663) | (17,472) | (15,574) |
| Other operating income | 59,535 | 78,898 | 45,303 | 273,579 | 87,732 |
| Other operating expenses | (123,329) | (124,482) | (77,354) | (203,130) | (52,723) |
| Profit before income tax | 212,882 | 399,433 | 565,962 | 901,508 | 1,064,842 |
| Income tax expenses | (70,747) | (109,635) | (135,919) | (188,955) | (225,642) |
| Profit for the year | 142,135 | 289,798 | 426,991 | 714,149 | 839,517 |
| Profit attributable to owners of the parent | 33,748 | 126,645 | 209,198 | 375,578 | 457,224 |
| Basic earnings per share (IDR) | 16 | 61 | 100 | 180 | 219 |
| Revenues from contracts with customers growth, derived | — | +23.5% | +26.6% | +24.5% | +18.9% |
Source: Consolidated Statement of Profit or Loss and Other Comprehensive Income [1] [2] [3] [4]. Click any linked figure to open the filing page with the row highlighted.
Balance Sheet
| Balance Sheet | FY2021 | FY2022 | FY2023 | FY2024 | FY2025 |
|---|---|---|---|---|---|
| Cash and cash equivalents | 427,483 | 351,786 | 453,153 | 1,480,054 | 1,774,110 |
| Total current assets | 702,469 | 768,491 | 1,012,398 | 1,918,594 | 2,274,727 |
| Fixed assets | 416,314 | 410,732 | 449,764 | 501,185 | 466,015 |
| Right-of-use assets | 107,595 | 128,945 | 96,206 | 138,426 | 201,227 |
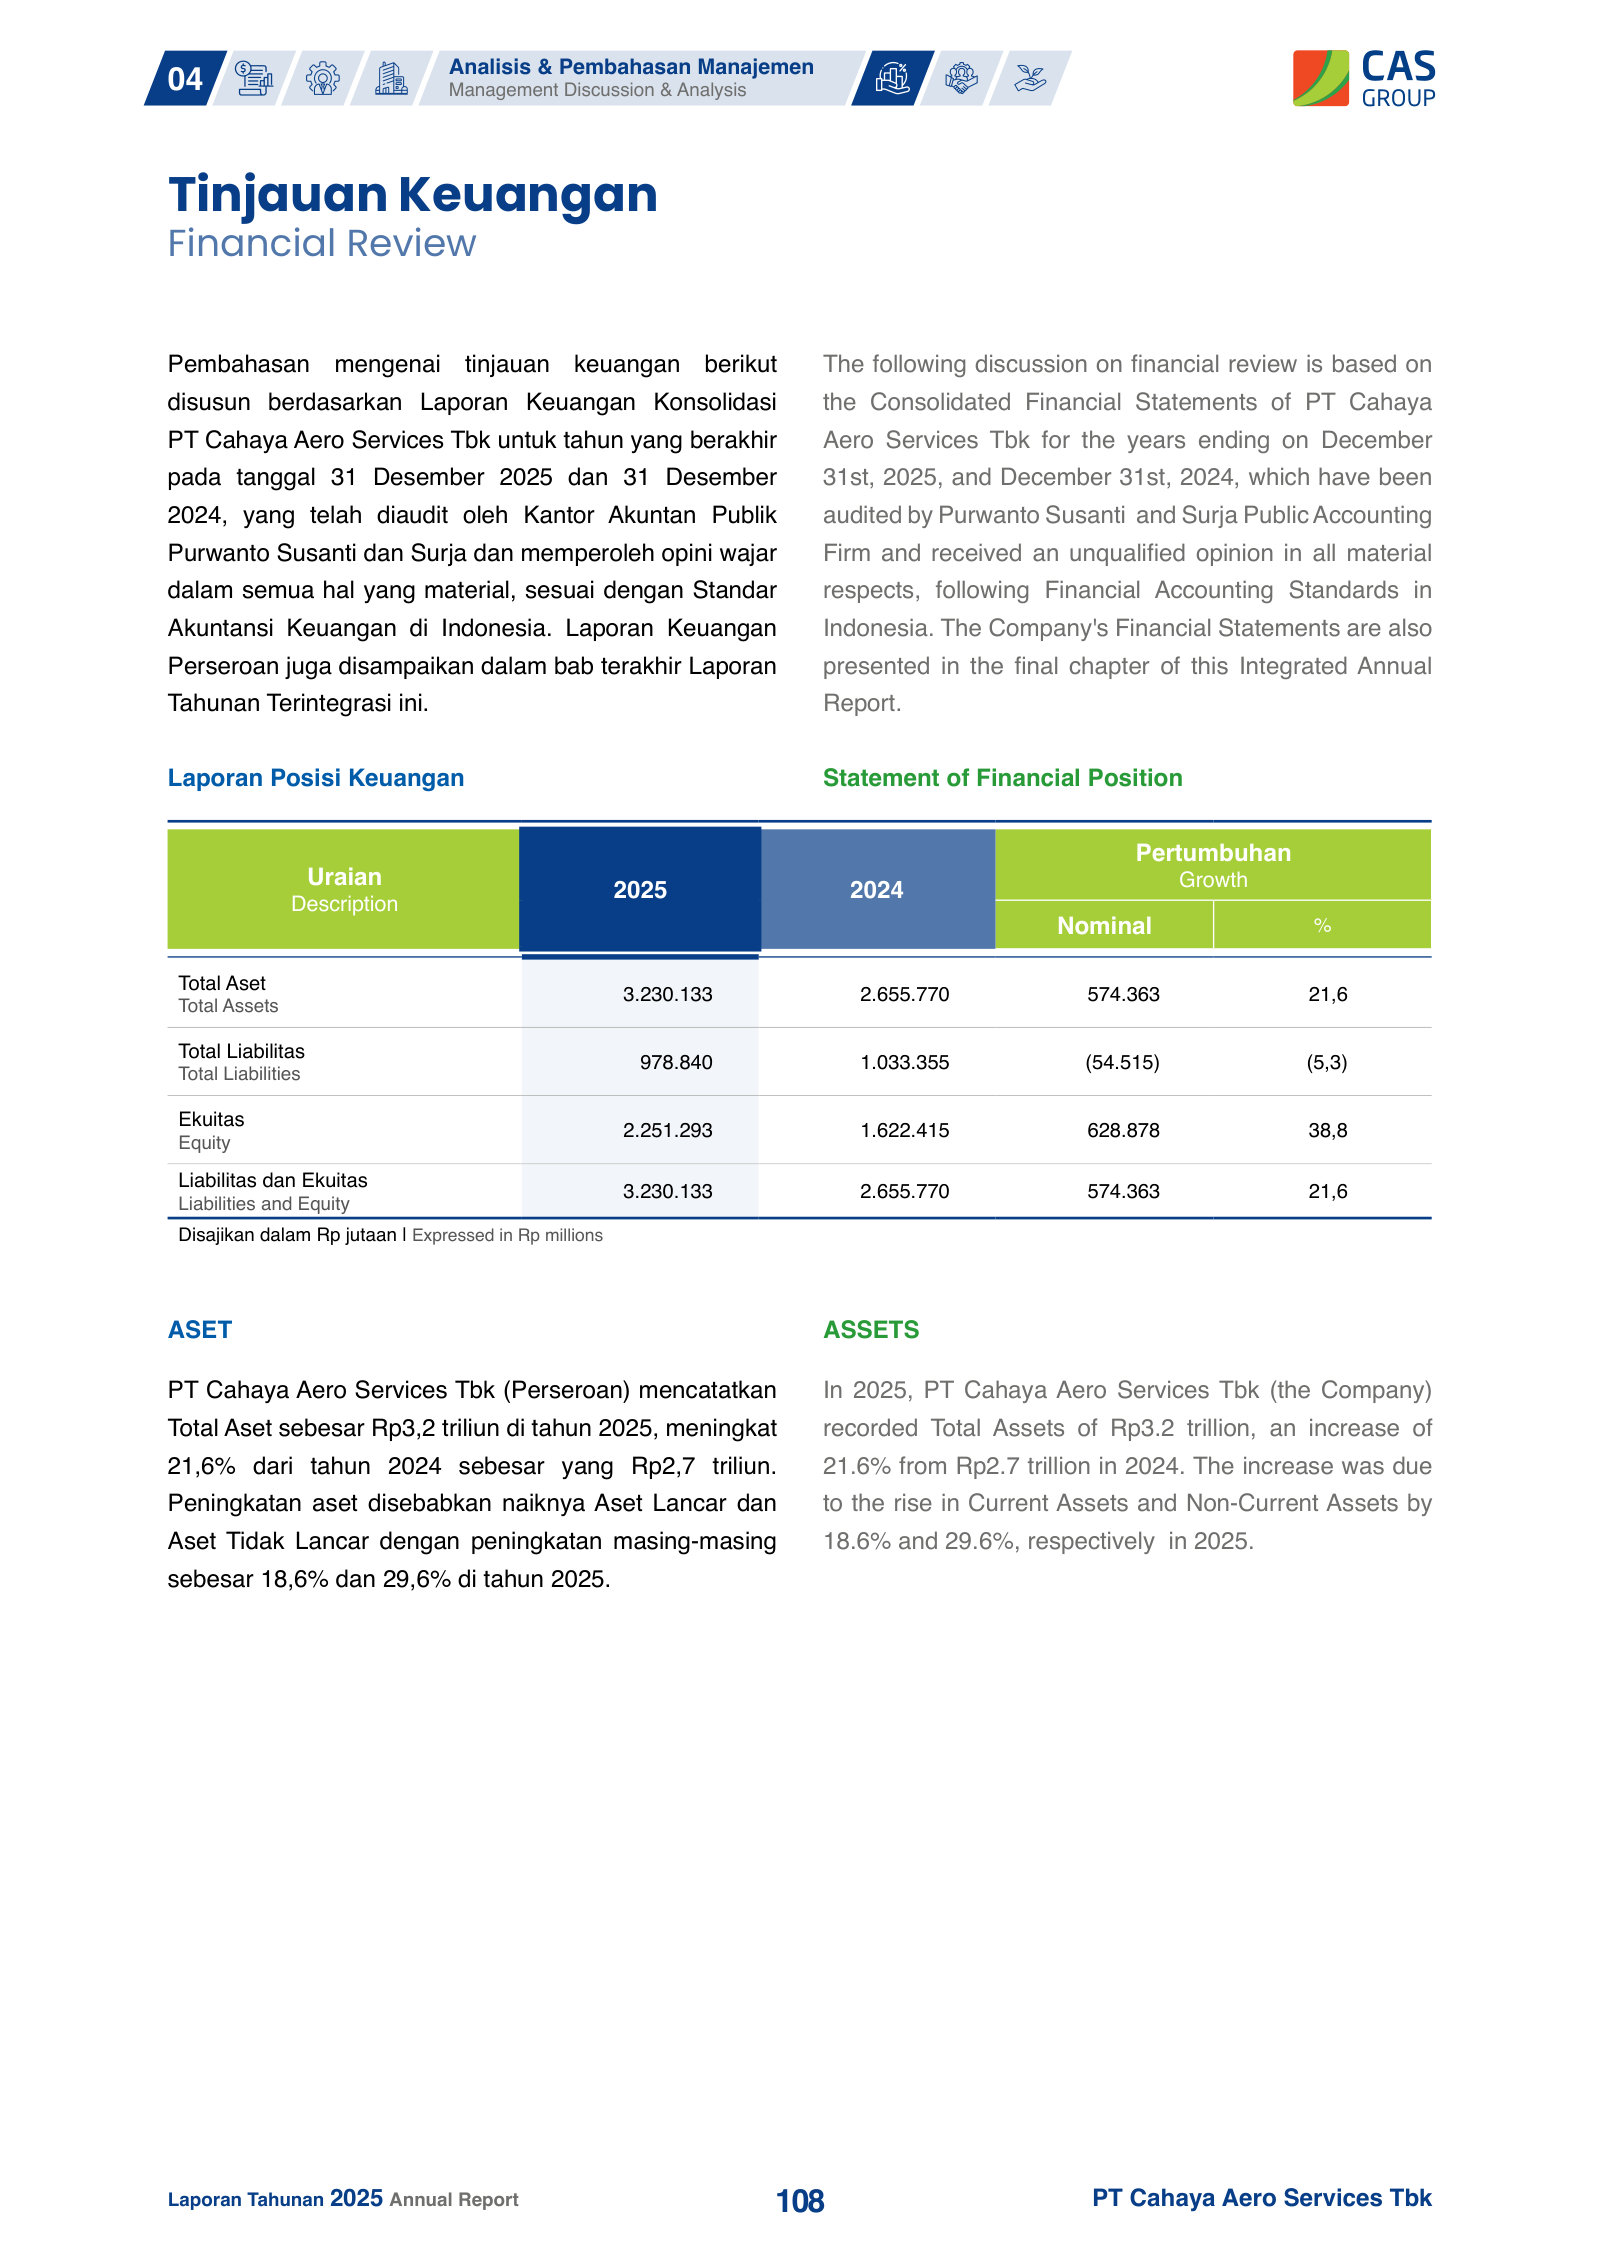
| Total assets | 1,575,065 | 1,686,235 | 1,919,403 | 2,655,770 | 3,230,133 |
| Total current liabilities | 847,294 | 764,222 | 758,293 | 862,022 | 766,472 |
| Total liabilities | 991,349 | 923,622 | 886,975 | 1,033,355 | 978,840 |
| Non-controlling interests | 199,170 | 251,734 | 316,875 | 534,361 | 711,804 |
| Equity attributable to owners of the parent | 384,546 | 510,879 | 715,553 | 1,088,054 | 1,539,489 |
| Total equity | 583,716 | 762,613 | 1,032,428 | 1,622,415 | 2,251,293 |
Source: Consolidated Statement of Financial Position [7] [8] [9] [10]. Click any linked figure to open the filing page with the row highlighted.
Cash Flow
| Cash Flow | FY2021 | FY2022 | FY2023 | FY2024 | FY2025 |
|---|---|---|---|---|---|
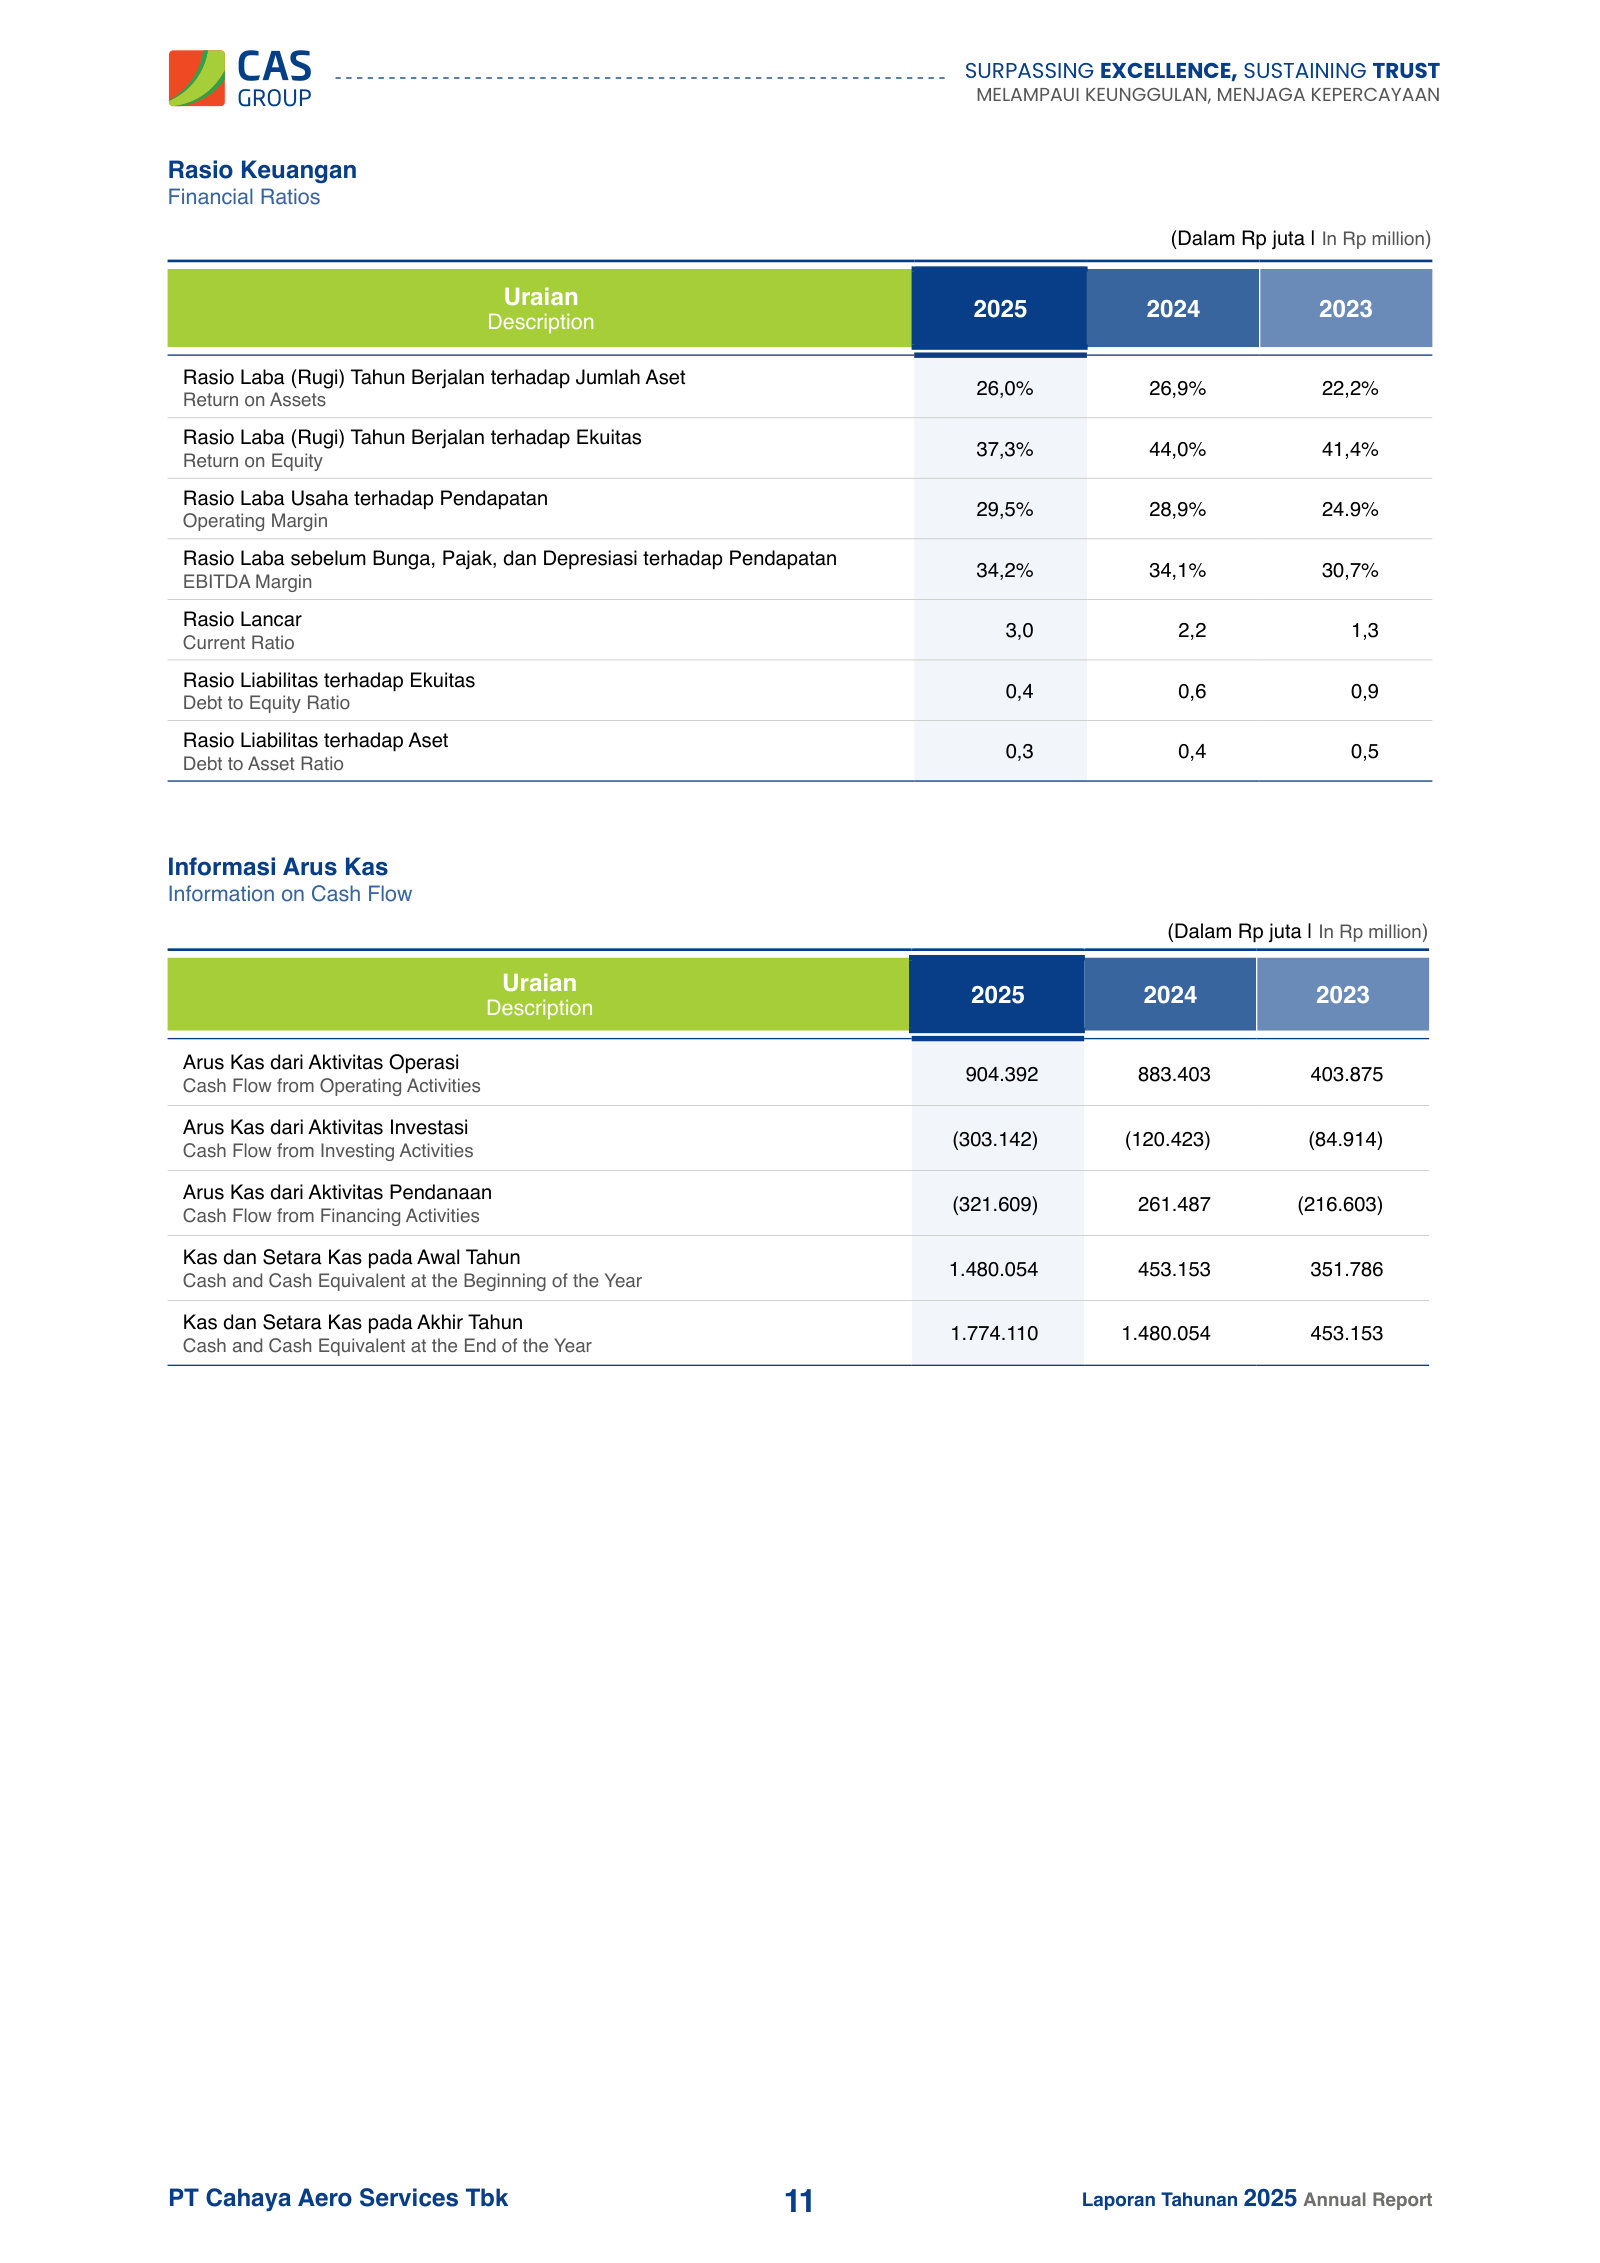
| Net cash provided by operating activities | 321,869 | 321,403 | 403,875 | 883,403 | 904,392 |
| Additions to fixed assets | (9,896) | (51,906) | (89,786) | (120,861) | (102,855) |
| Net cash used in investing activities | (6,523) | (133,947) | (84,914) | (120,423) | (303,142) |
| Payment of cash dividends | (21,364) | (113,000) | (148,887) | (117,412) | (256,018) |
| Payment of lease liabilities | (62,494) | (62,331) | (67,716) | (77,500) | (66,993) |
| Net cash provided by (used in) financing activities | (162,621) | (267,612) | (216,603) | 261,487 | (321,609) |
| Net increase (decrease) in cash and cash equivalents | 152,725 | (80,156) | 102,358 | 1,024,467 | 279,641 |
| Cash and cash equivalents at end of year | 427,483 | 351,786 | 453,153 | 1,480,054 | 1,774,110 |
Source: Consolidated Statement of Cash Flows [11] [12] [13] [14]. Click any linked figure to open the filing page with the row highlighted.
Revenue by Service Line (pre-2025 segment basis)
| Revenue by Service Line (pre-2025 segment basis) | FY2021 | FY2022 | FY2023 | FY2024 | FY2025 |
|---|---|---|---|---|---|
| Ground and Cargo Handling | 1,222,741 | 1,440,675 | 1,720,343 | 2,202,375 | — |
| Aircraft Release and Maintenance Services | 60,409 | 119,946 | 208,577 | 238,787 | — |
| Catering | 114,184 | 184,094 | 325,198 | 369,620 | — |
| Facility Management Services | 27,640 | 21,313 | — | — | — |
| Aviation Training | 1,869 | 7,602 | 8,273 | 8,728 | — |
| Eliminations | (19,447) | (35,884) | (63,174) | (81,023) | — |
| Total revenue | 1,407,396 | 1,737,746 | 2,199,217 | 2,738,487 | 3,255,520 |
Source: Segment Information notes, FY2021–FY2024 Annual Reports [2] [15] [16] [17]. Click any linked figure to open the filing page with the row highlighted.
Operating Scale Network (Ground Handling)
| Operating Scale Network (Ground Handling) | FY2021 | FY2022 | FY2023 | FY2024 | FY2025 |
|---|---|---|---|---|---|
| Flights handled — ground handling | — | 42,648 | 71,945 | 76,287 | 80,198 |
| Cargo handled (tons) | — | 226,804 | 222,588 | 291,654 | 320,531 |
| Passengers handled | — | 11,813,049 | 23,478,007 | 26,153,442 | 27,504,587 |
| Lounge guests | — | 116,898 | 245,815 | 293,021 | 322,147 |
| Major airports served (JAS network) | 6 | 9 | 9 | 9 | 10 |
| Total employees (Group, period-end) | 3,538 | 3,633 | 3,807 | 4,177 | 4,599 |
Source: company filings [18] [19] [20] [21]. Click any linked figure to open the filing page with the row highlighted.
Engineering, Catering Training
| Engineering, Catering Training | FY2021 | FY2022 | FY2023 | FY2024 | FY2025 |
|---|---|---|---|---|---|
| Aircraft release certifications (flights) | — | 17,975 | 37,435 | 41,762 | 52,131 |
| Technical ramp services (flights) | — | 17,503 | 34,497 | 38,568 | 41,788 |
| Commercial training participants | — | 2,537 | 3,798 | 4,972 | 4,609 |
| Inflight catering meals served (PMAD) | — | — | — | 2,451,915 | 4,141,301 |
| Non-aviation (institutional) meals served | — | — | — | 5,471,185 | 5,871,722 |
Source: company filings [22] [18] [21] [23]. Click any linked figure to open the filing page with the row highlighted.
Profitability Balance-Sheet Ratios (as reported)
| Profitability Balance-Sheet Ratios (as reported) | FY2021 | FY2022 | FY2023 | FY2024 | FY2025 |
|---|---|---|---|---|---|
| Return on assets (ROA) | 9.0% | 17.2% | 22.2% | 26.9% | 26.0% |
| Return on equity (ROE) | 24.4% | 38.0% | 41.4% | 44.0% | 37.3% |
| Operating margin | 17.0% | 23.0% | 24.9% | 28.9% | 29.5% |
| EBITDA margin | 24.7% | 29.8% | 30.7% | 34.1% | 34.2% |
| Current ratio | 0.8 | 1.0 | 1.3 | 2.2 | 3.0 |
| Debt-to-equity ratio | 1.7 | 1.2 | 0.9 | 0.6 | 0.4 |
Source: company filings [24] [25]. Click any linked figure to open the filing page with the row highlighted.
Long-Term Record
| Fiscal year | Total revenue | Operating income | Net income attributable to owners | Basic earnings per share (IDR) | Operating cash flow |
|---|---|---|---|---|---|
| FY2016 | 1,778,034 | 433,812 | 121,169 | 58 | 343,560 |
| FY2017 | 2,057,650 | 503,372 | 130,672 | 63 | 362,463 |
| FY2018 | 2,200,342 | 330,851 | (13,871) | (7) | 380,240 |
| FY2019 | 2,194,306 | 435,326 | (139,110) | (67) | 374,517 |
| FY2020 | 1,222,921 | 29,033 | (88,147) | (42) | 248,120 |
| FY2021 | 1,407,396 | 239,602 | 33,748 | 16 | 321,869 |
| FY2022 | 1,737,746 | 400,297 | 126,645 | 61 | 321,403 |
| FY2023 | 2,199,217 | 548,552 | 209,198 | 100 | 403,875 |
| FY2024 | 2,738,487 | 791,060 | 375,578 | 180 | 883,403 |
| FY2025 | 3,255,520 | 959,198 | 457,224 | 219 | 904,392 |
Source: consolidated statements across filings; older years from the standardized feed [11] [1] [2] [3]. Click any linked figure to open the filing page with the row highlighted.
Analyst Consensus
Mean target
Street ratings: No consensus rating or price target available. PT Cahaya Aero Services Tbk (CASS.JK / IDX:CASS) is listed by Simply Wall St as covered by 3 analysts, but 0 of those analysts submitted revenue or earnings estimates, and price-target forecast data is described as insufficient to display. stockanalysis.com shows analyst price target as 'n/a'; Investing.com states 'Analysts Sentiment: Currently not supported'; TradingView has no /forecast/ page (HTTP 404). No buy/hold/sell counts exist from any reputable aggregator. The 0 value for analyst_price_target_mean is a null placeholder required by the schema, NOT an actual price target. Caution: MarketBeat/Zacks results for ticker 'CASS' refer to Cass Information Systems (NASDAQ), an unrelated US company, and must not be used for this Indonesian issuer.
Estimate source: analyst consensus (claude_web), as of 2026-07-30. Forecasts carry no filing page links.
Traceability
285 of 310 figures on this page (92%) link to the filing page where they are printed — click a linked figure to open the source PDF at that page with the row highlighted. Unlinked figures come from standardized data feeds or pre-filing years.
All figures in millions of Rupiah, exactly as printed in the audited consolidated financial statements ('Expressed in millions of Rupiah'). Per-share amounts are in full Rupiah.
Net income shown is profit attributable to owners of the parent (the basis used by the data feed); 'Profit for the year' above it is the total including non-controlling interests, which take a large share (NCI is the listed subsidiary PT Jasa Angkasa Semesta).
Segment reporting changed in 2025: FY2021–FY2024 reports disaggregate revenue into four service-line segments (Ground and Cargo Handling, Aircraft Release and Maintenance, Catering, Aviation Training); from FY2025 the company reports two divisions (Aviation vs Non-Aviation). The hero 'Revenue by Operating Division' uses the current Aviation/Non-Aviation basis (FY2024–FY2025, from the FY2025 report); the 'Revenue by Service Line' table preserves the FY2021–FY2024 detail.
Facility Management Services was reported as a separate revenue segment only in FY2021–FY2022; it does not appear in the FY2023–FY2024 four-segment note.
FY2016–FY2020 long-term figures come from the standardized data feed (fiscal.ai) and are shown without page links; FY2016–FY2018 predate the filings in the corpus. FY2020 comparative figures also appear in the FY2021 report.
The company was renamed from PT Cardig Aero Services Tbk to PT Cahaya Aero Services Tbk in 2025 following the April 2024 acquisition of a 51% stake by EMTEK Group (via PT Roket Cipta Sentosa).
FY2024 financing cash flow is a net inflow, reflecting a Rp456,399m receipt of third-party loan repayments from entities that ceased to be related parties on 25 April 2024.
Goodwill (Rp14,874m through FY2024) is omitted from the balance-sheet summary as immaterial; it was reduced to nil in FY2025 on disposal of a subsidiary.
3 figure(s) differed between the data feed and the filing; the filing value is shown (see the run's metrics/metrics_tab.json for the audit trail).
PT Cahaya Aero Services Tbk's management explains the business in its own materials. The slides below do the most of that work, pulled from the documents preserved in Sources. Each source link opens the complete presentation at that slide in a new tab.
Annual Public Expose 2026 — FY2025
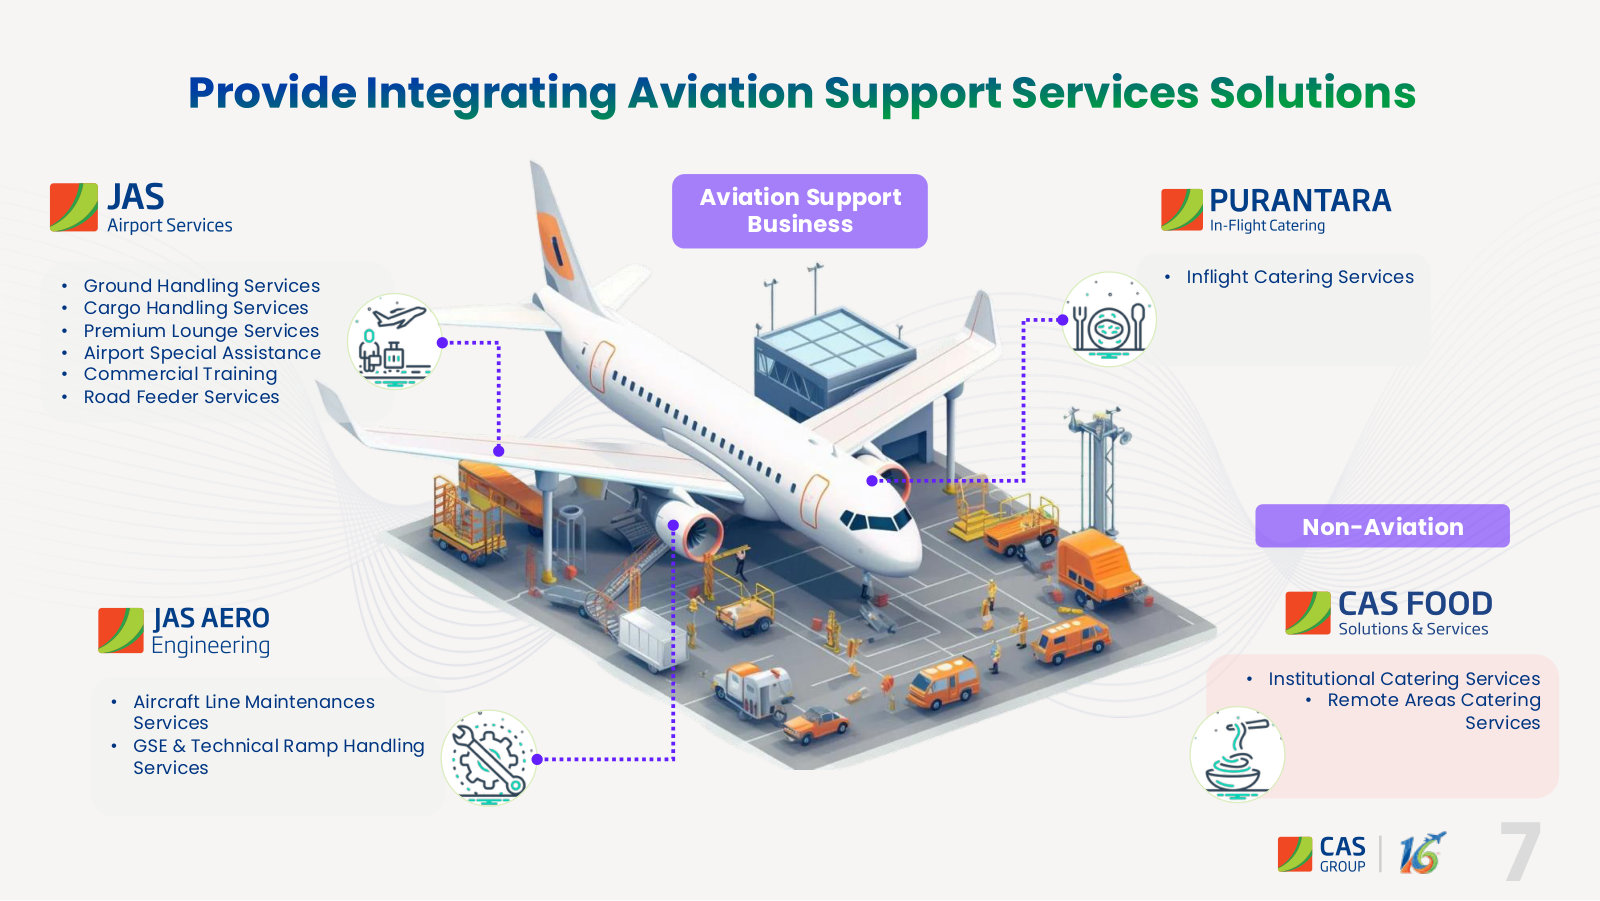
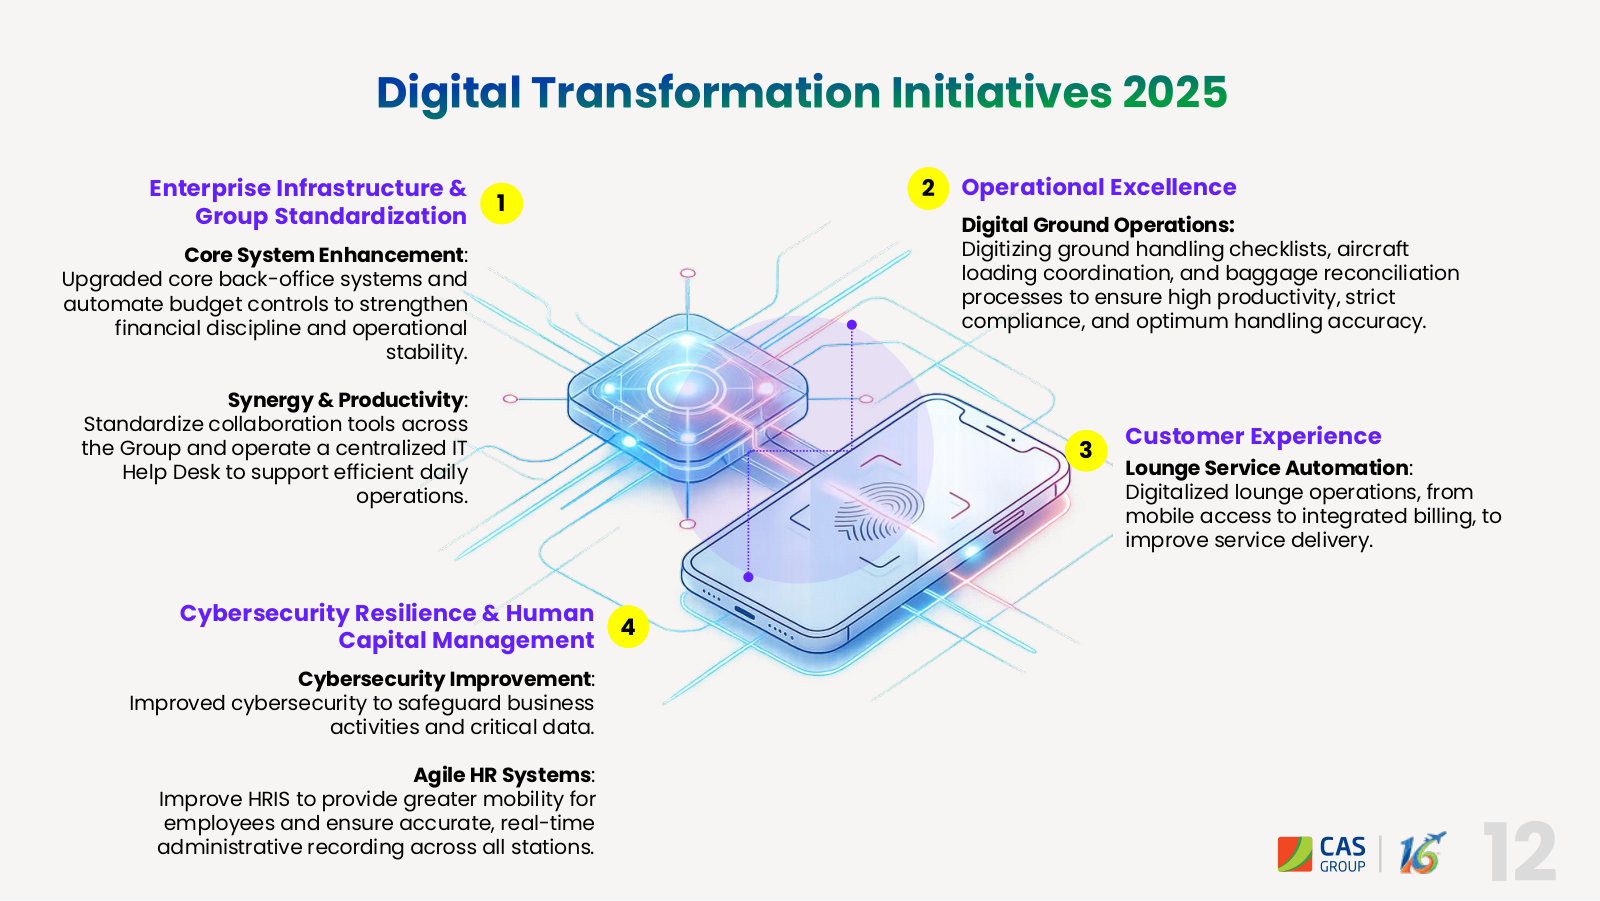
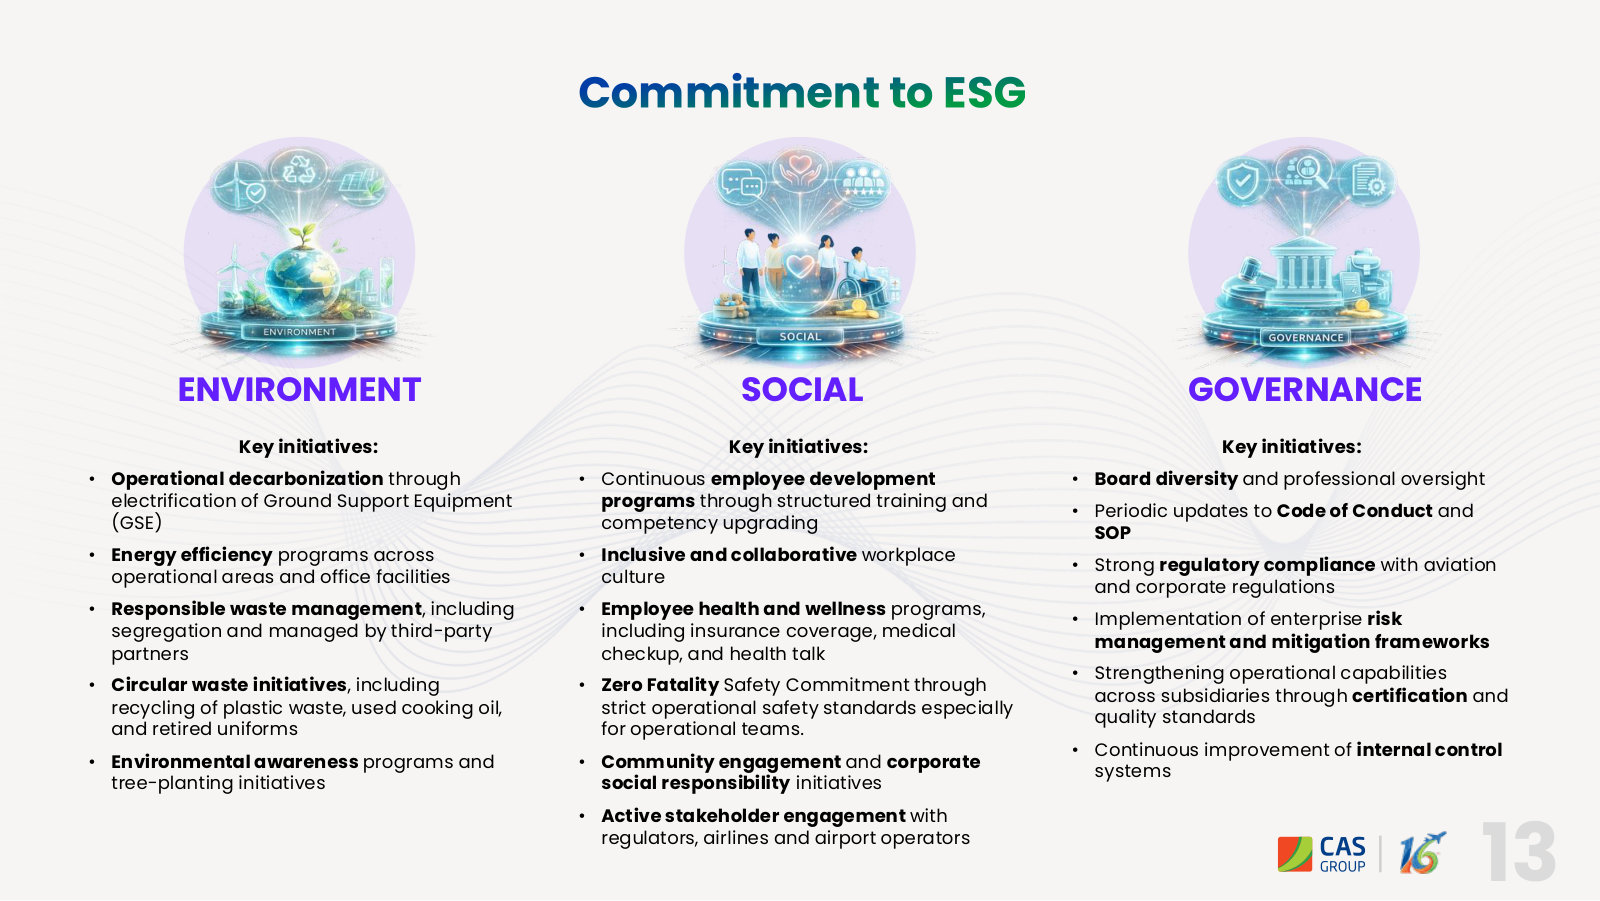
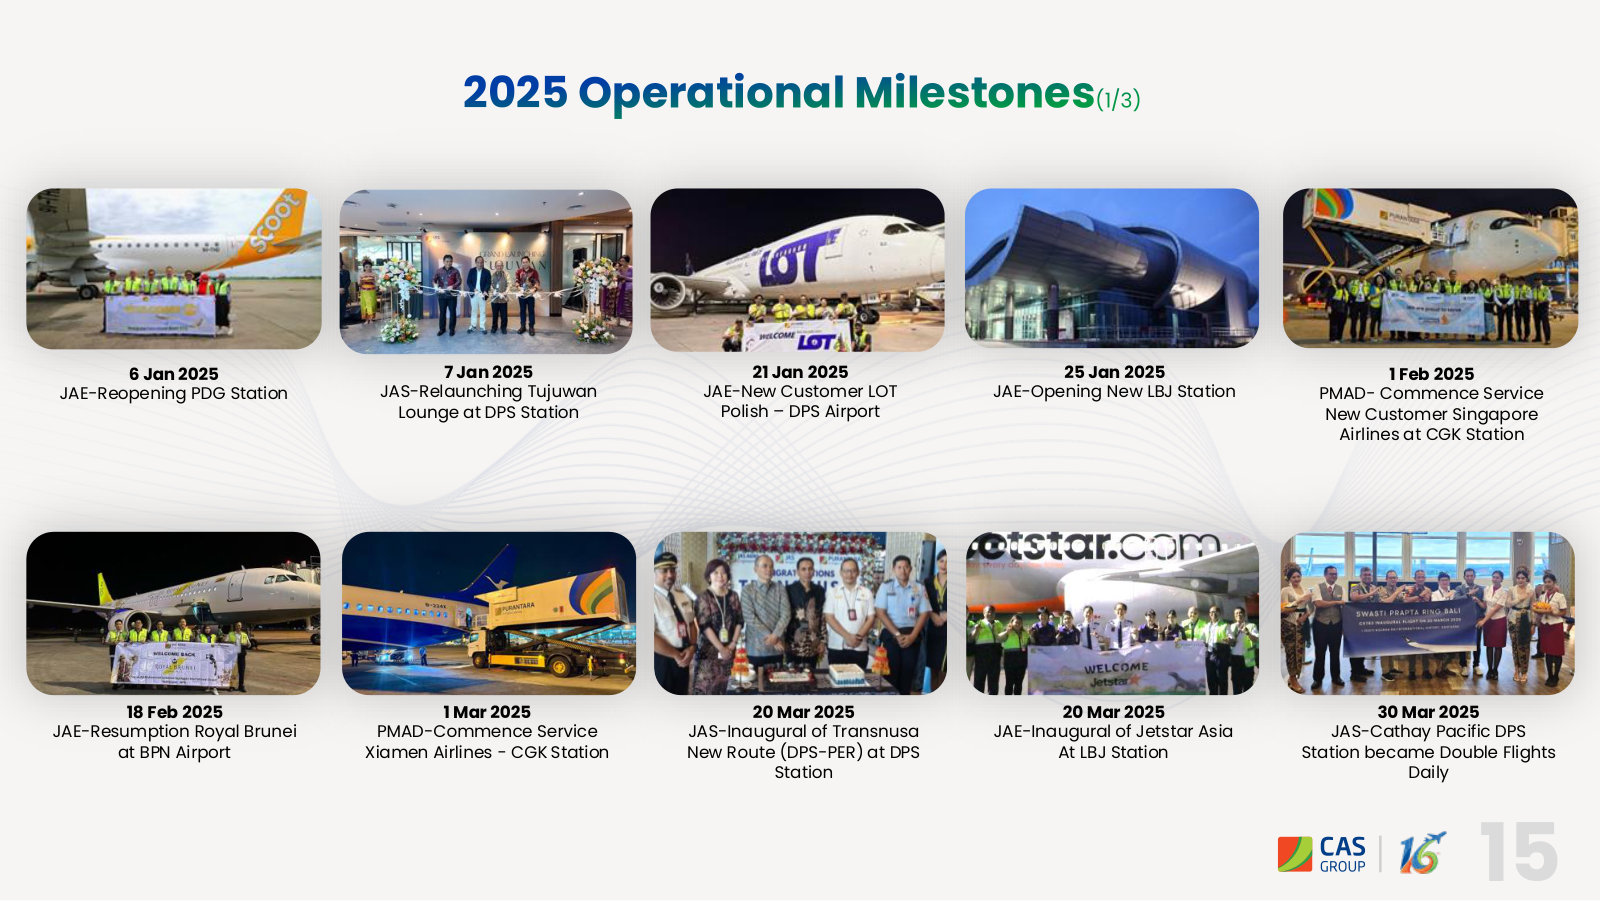
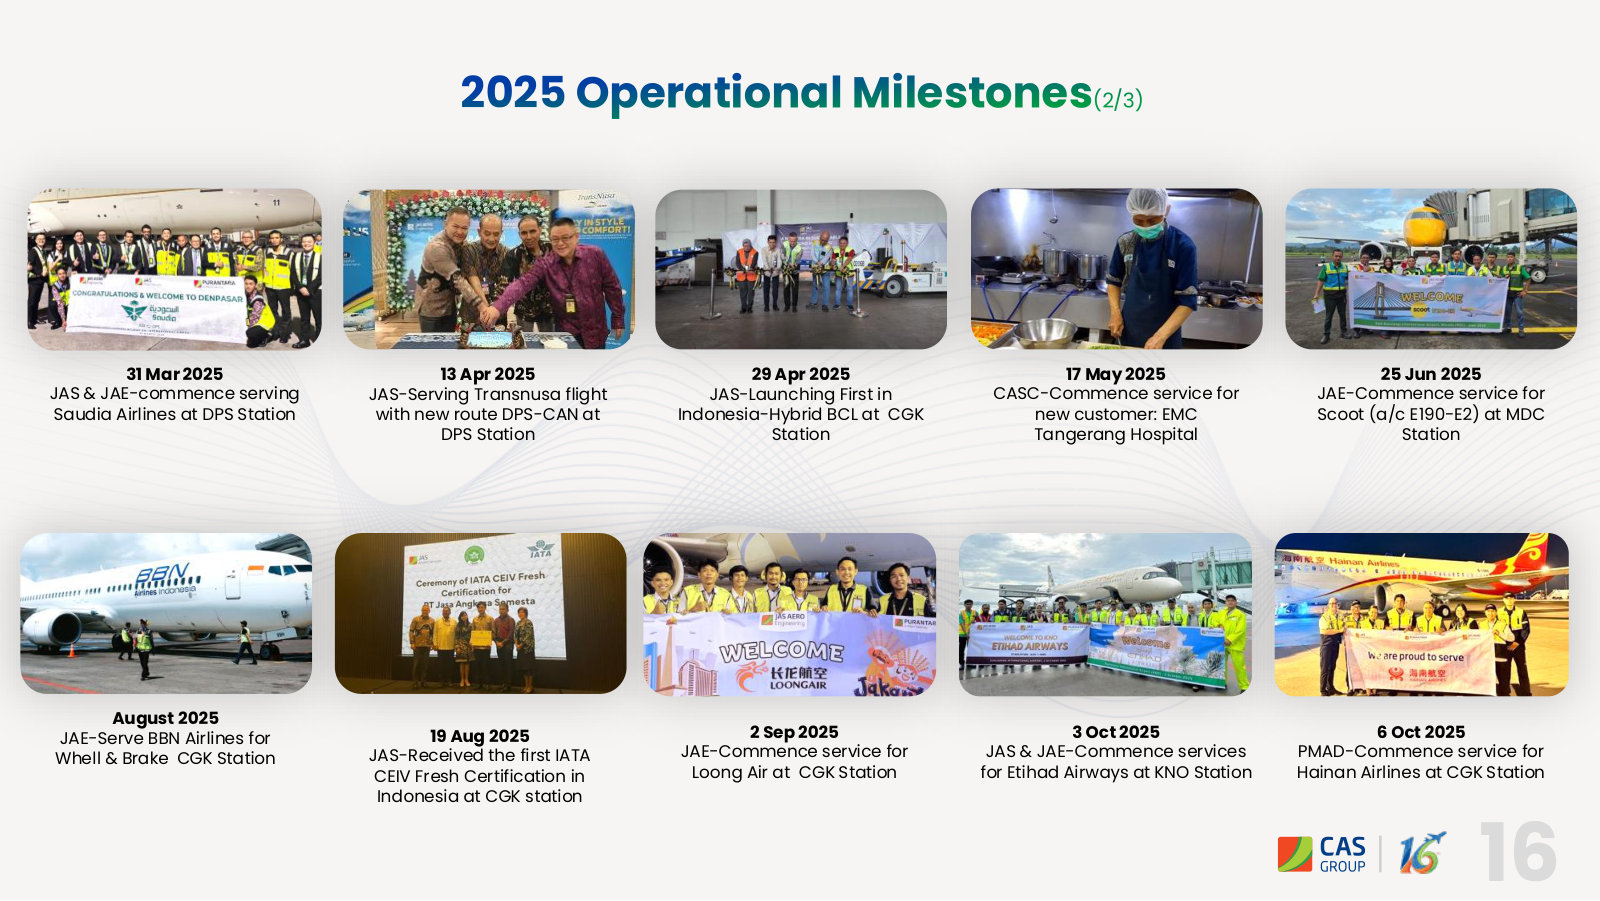
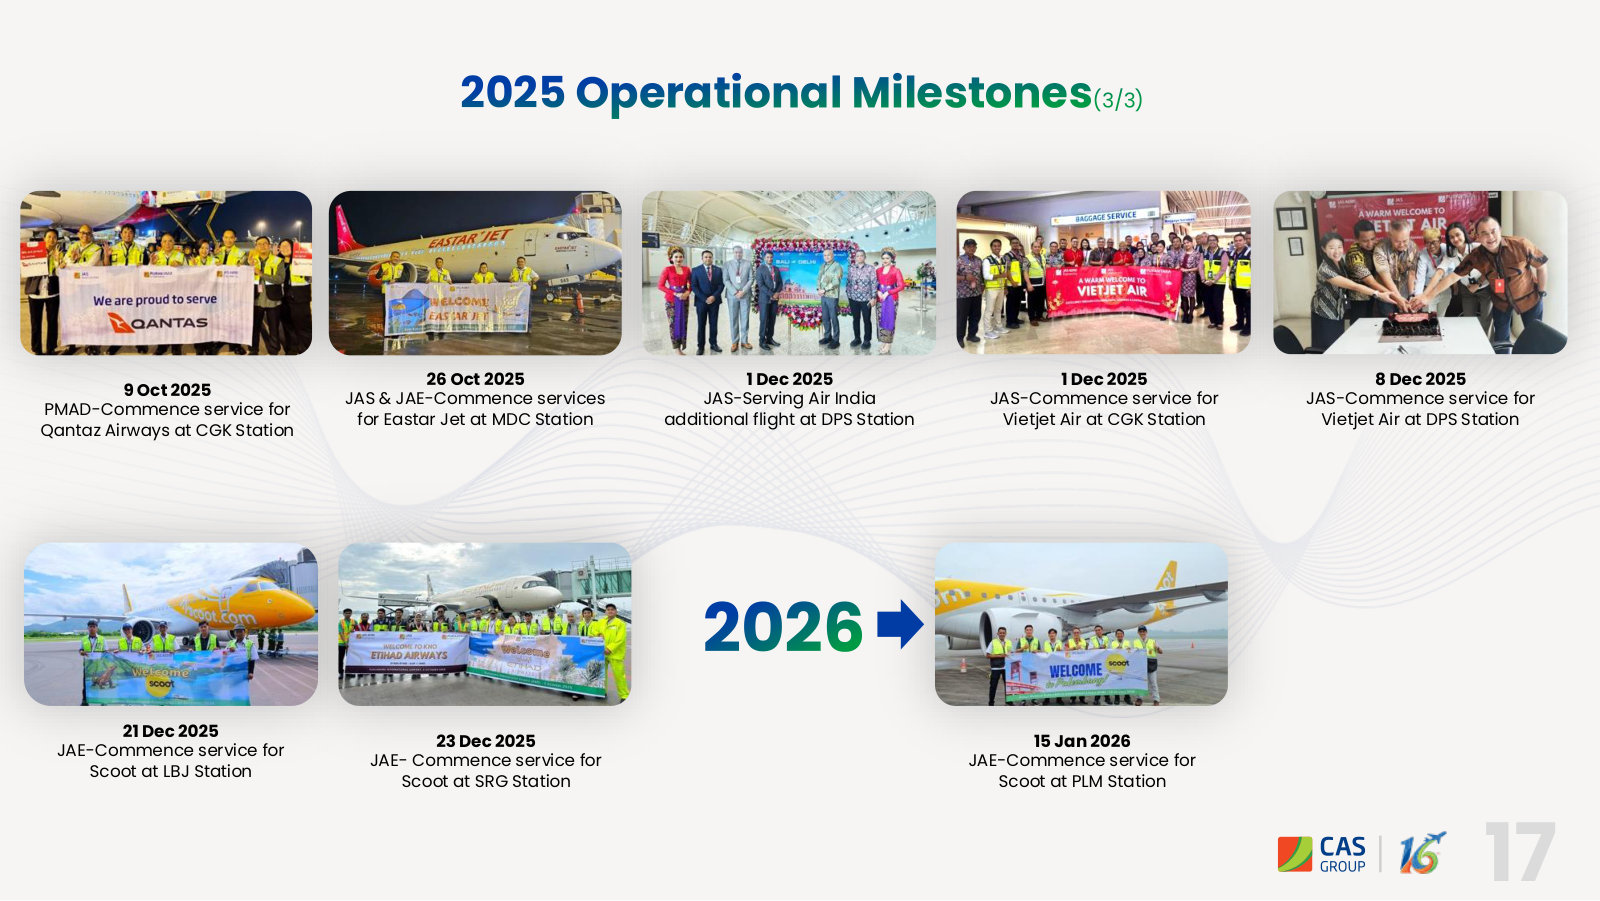
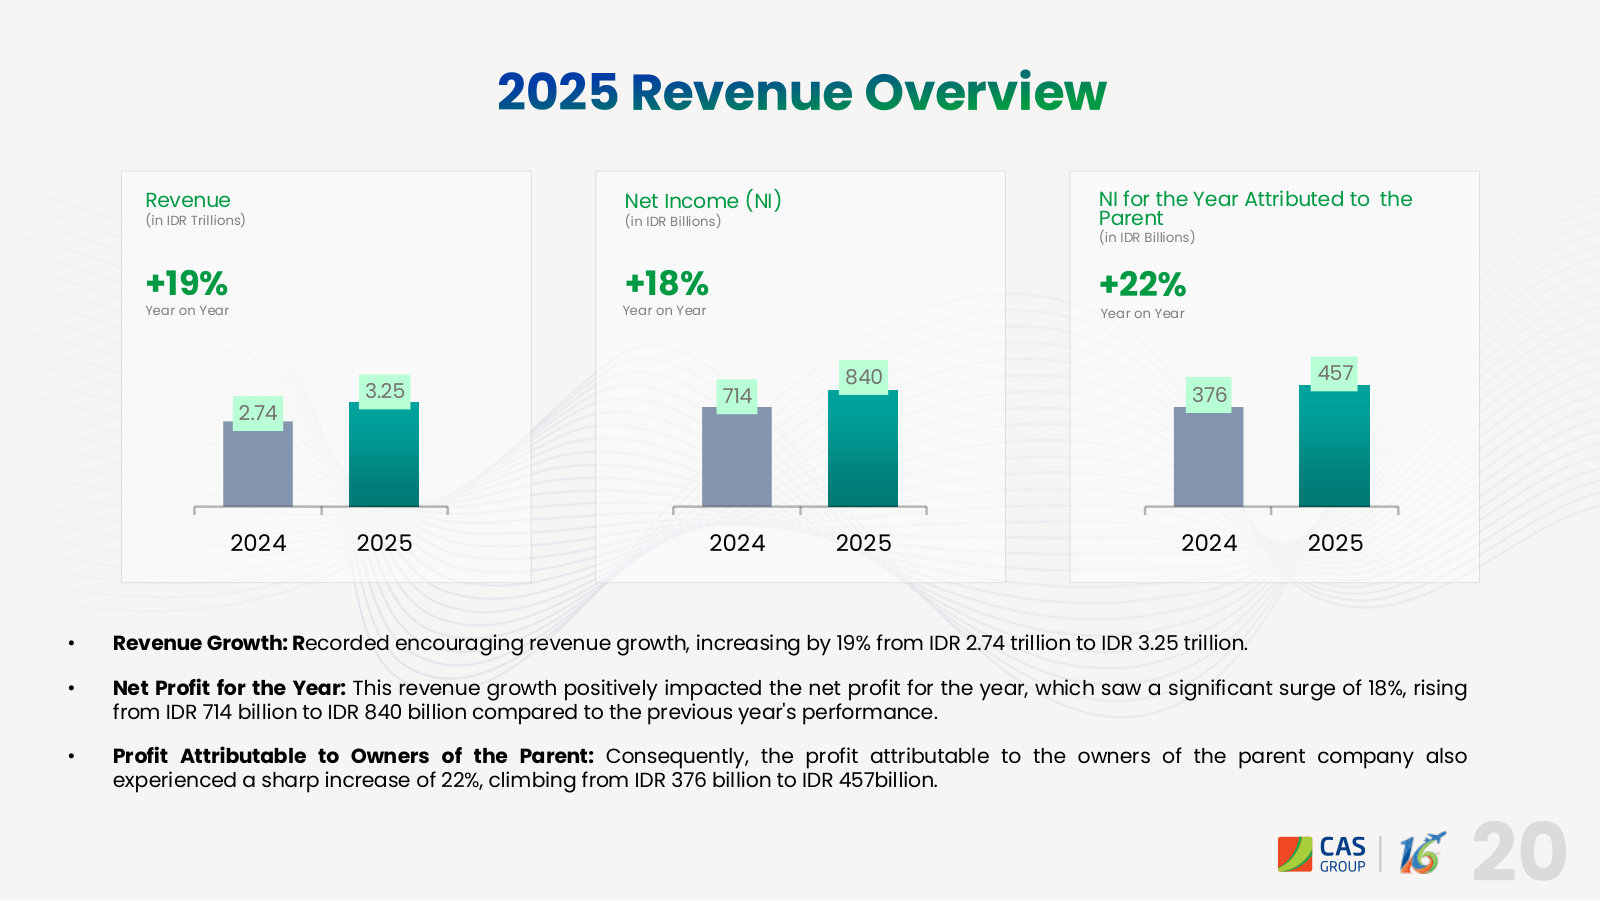
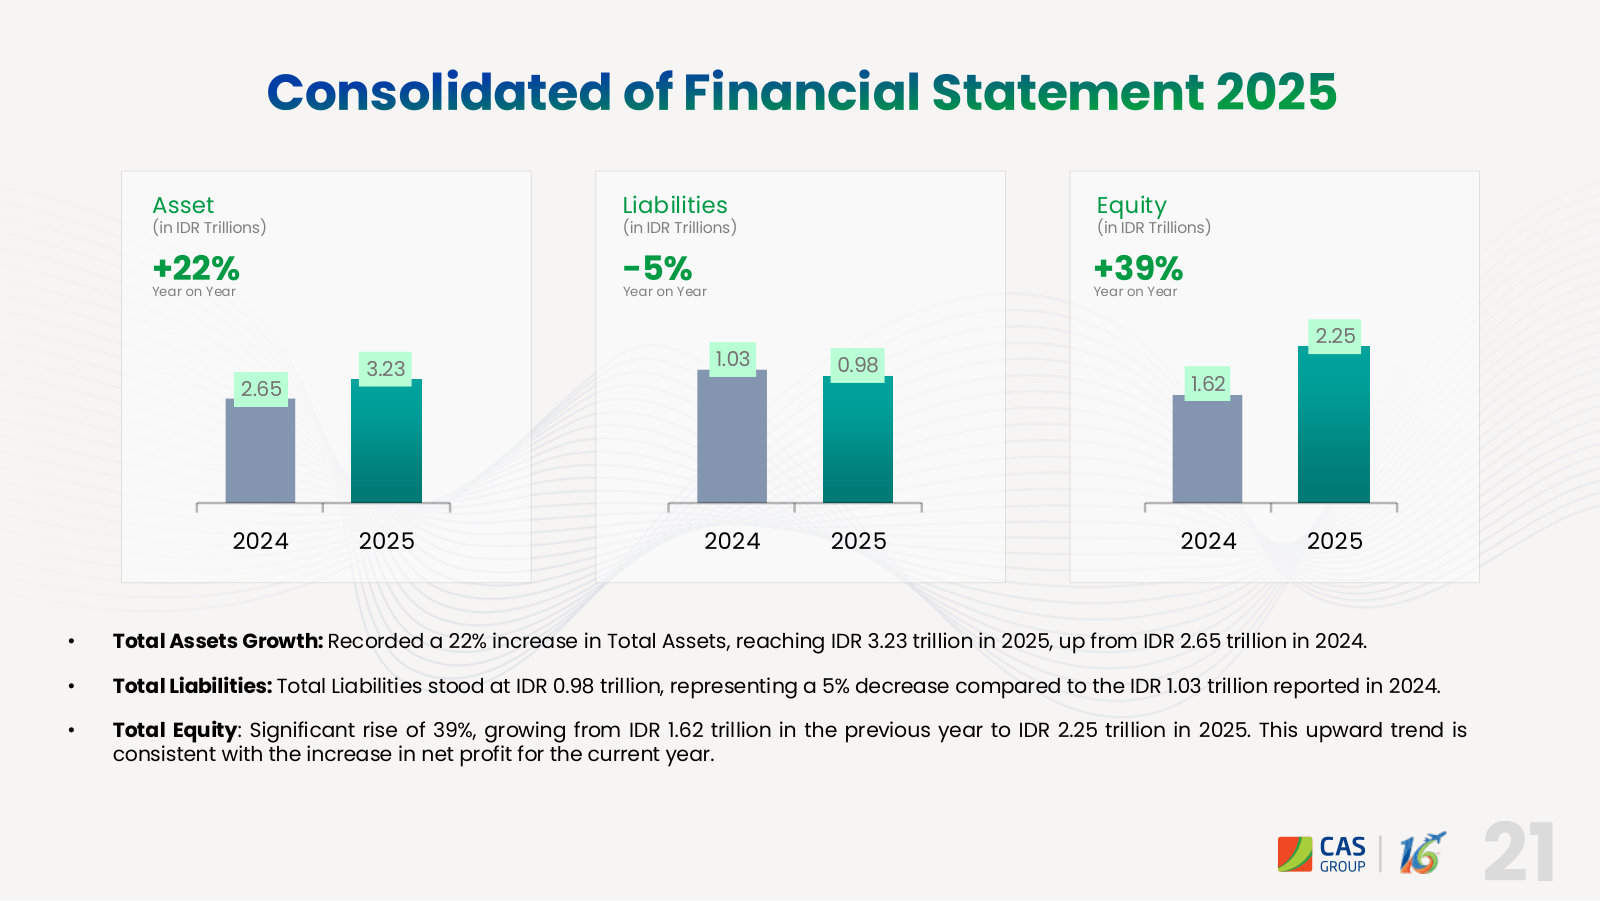
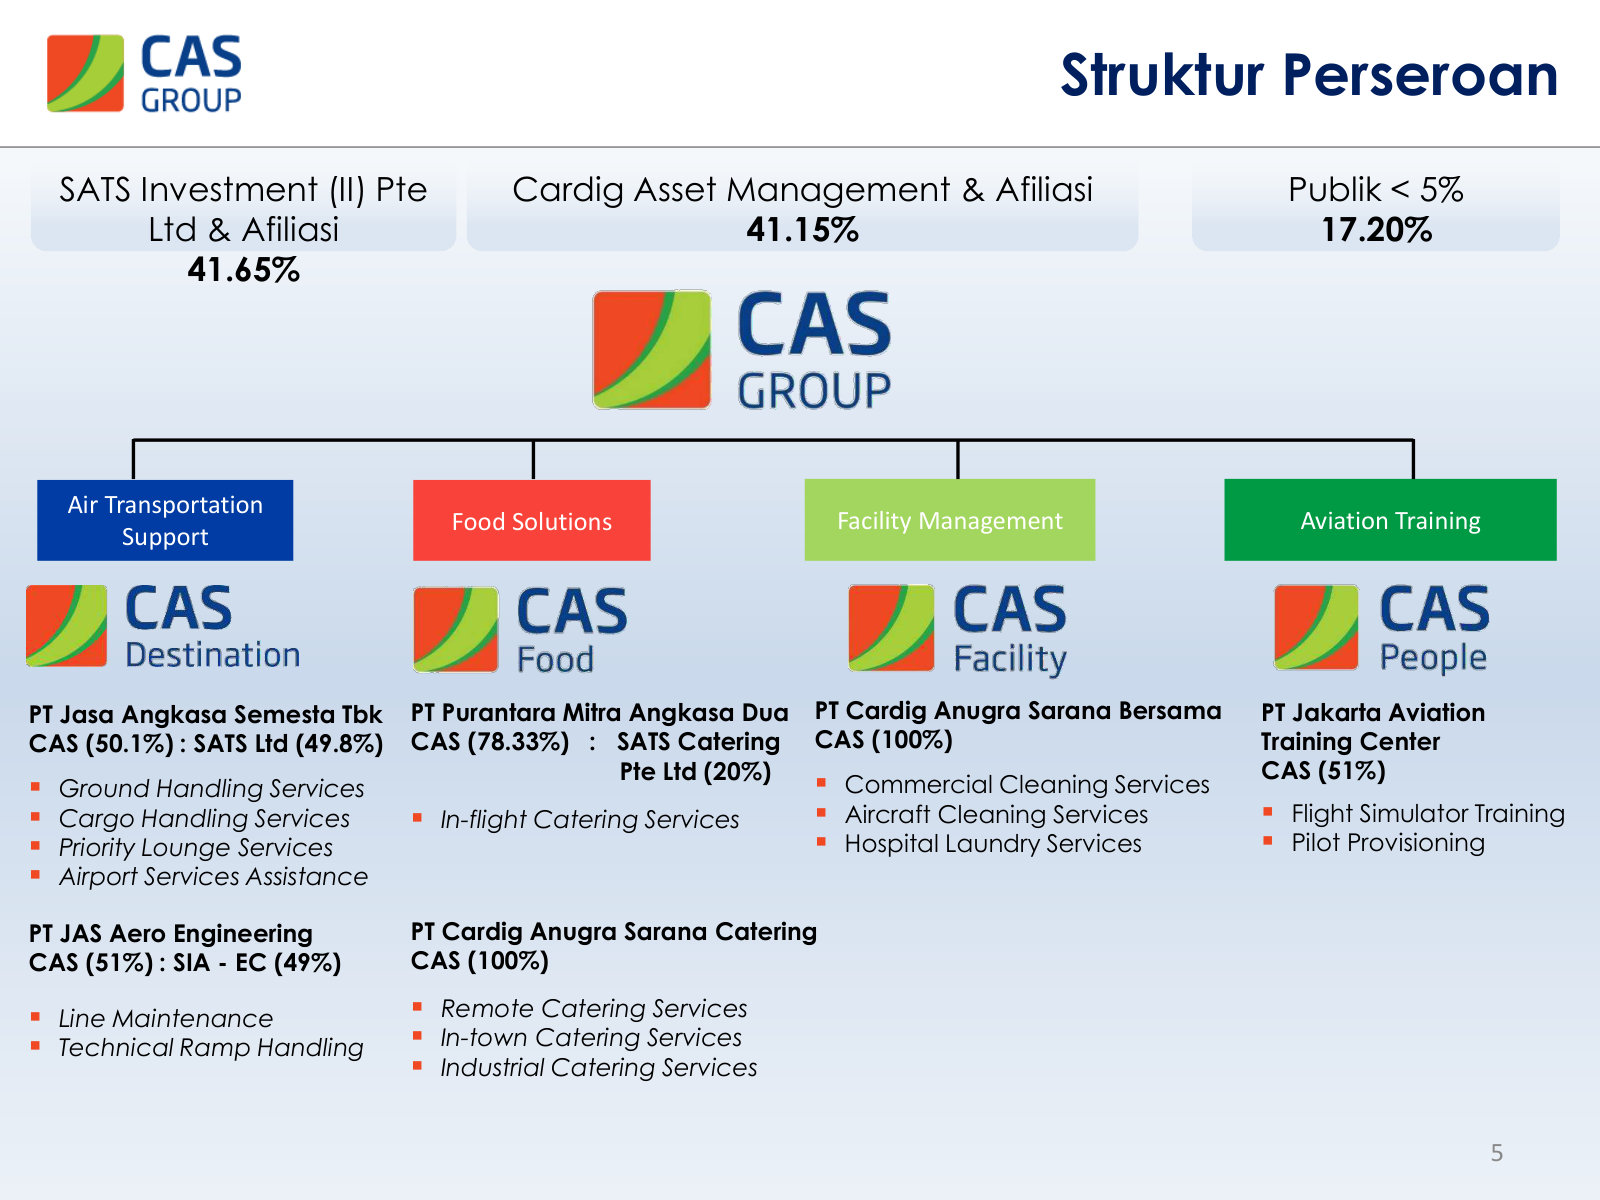
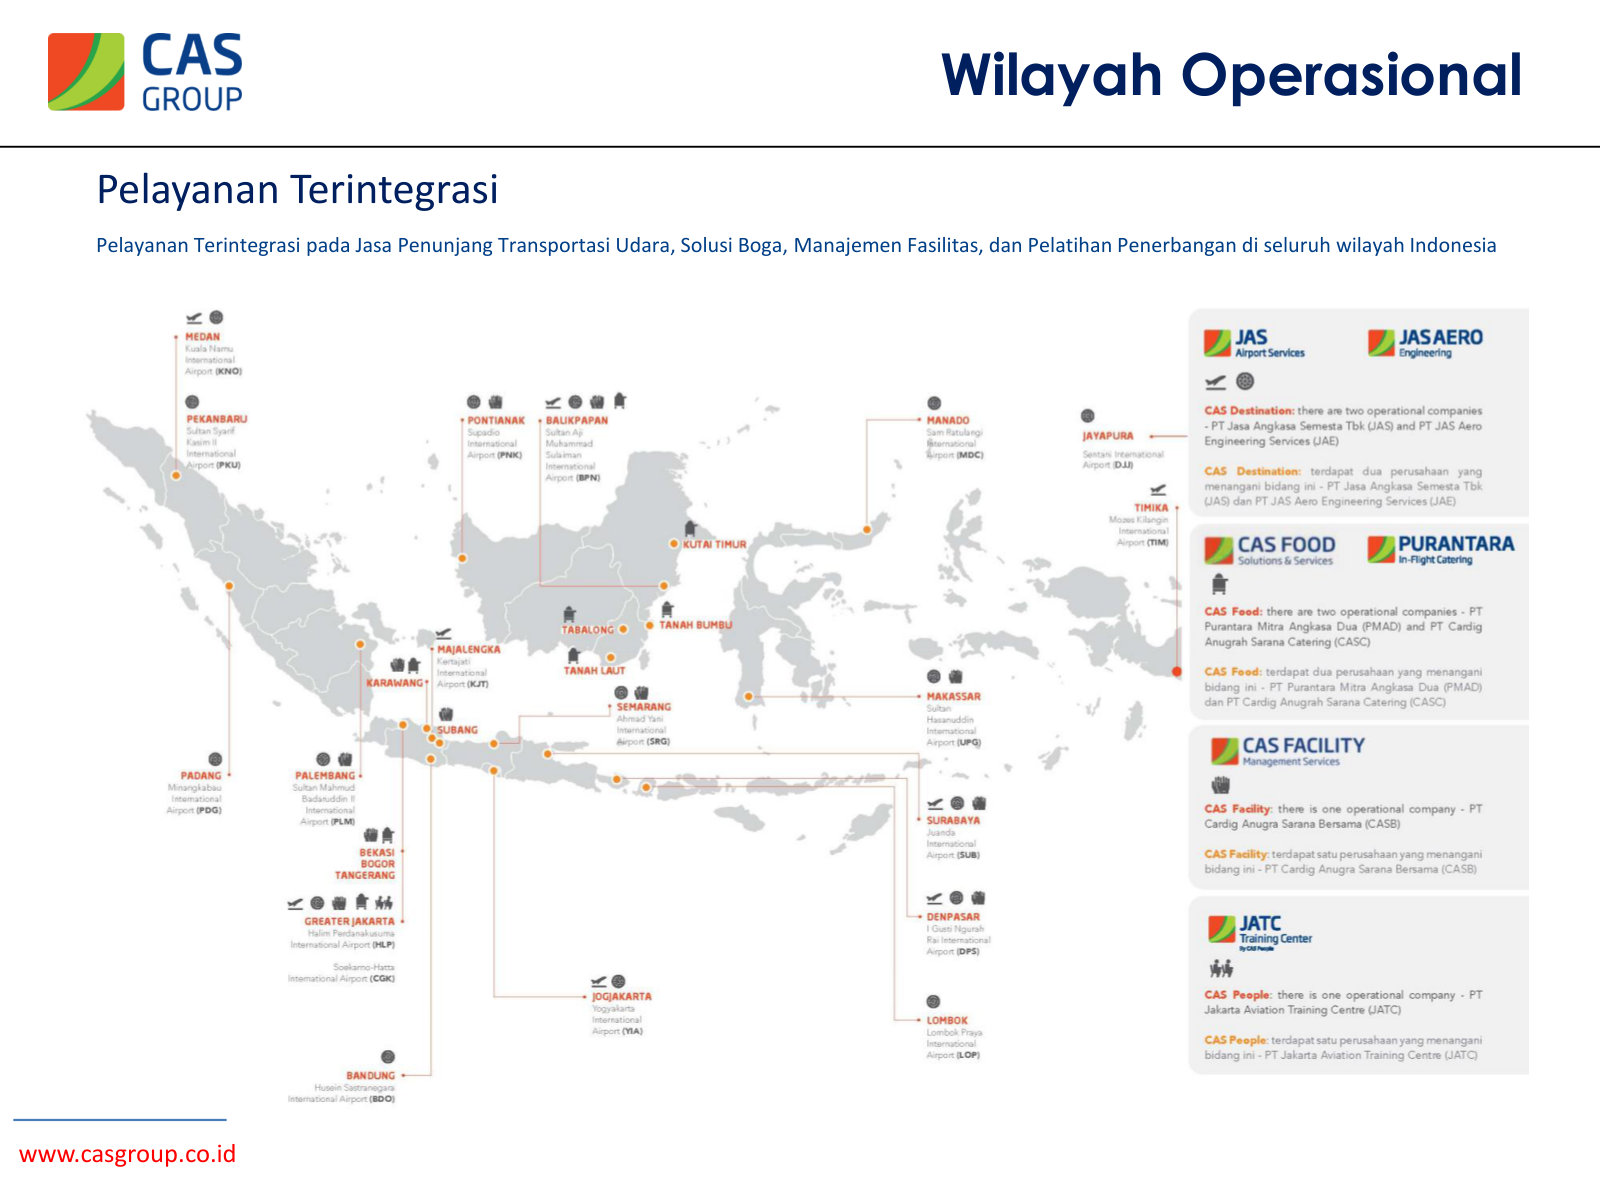
Management's current self-description: group structure, what each subsidiary sells, where it operates, and FY2025 volumes and results. · Open the full document →
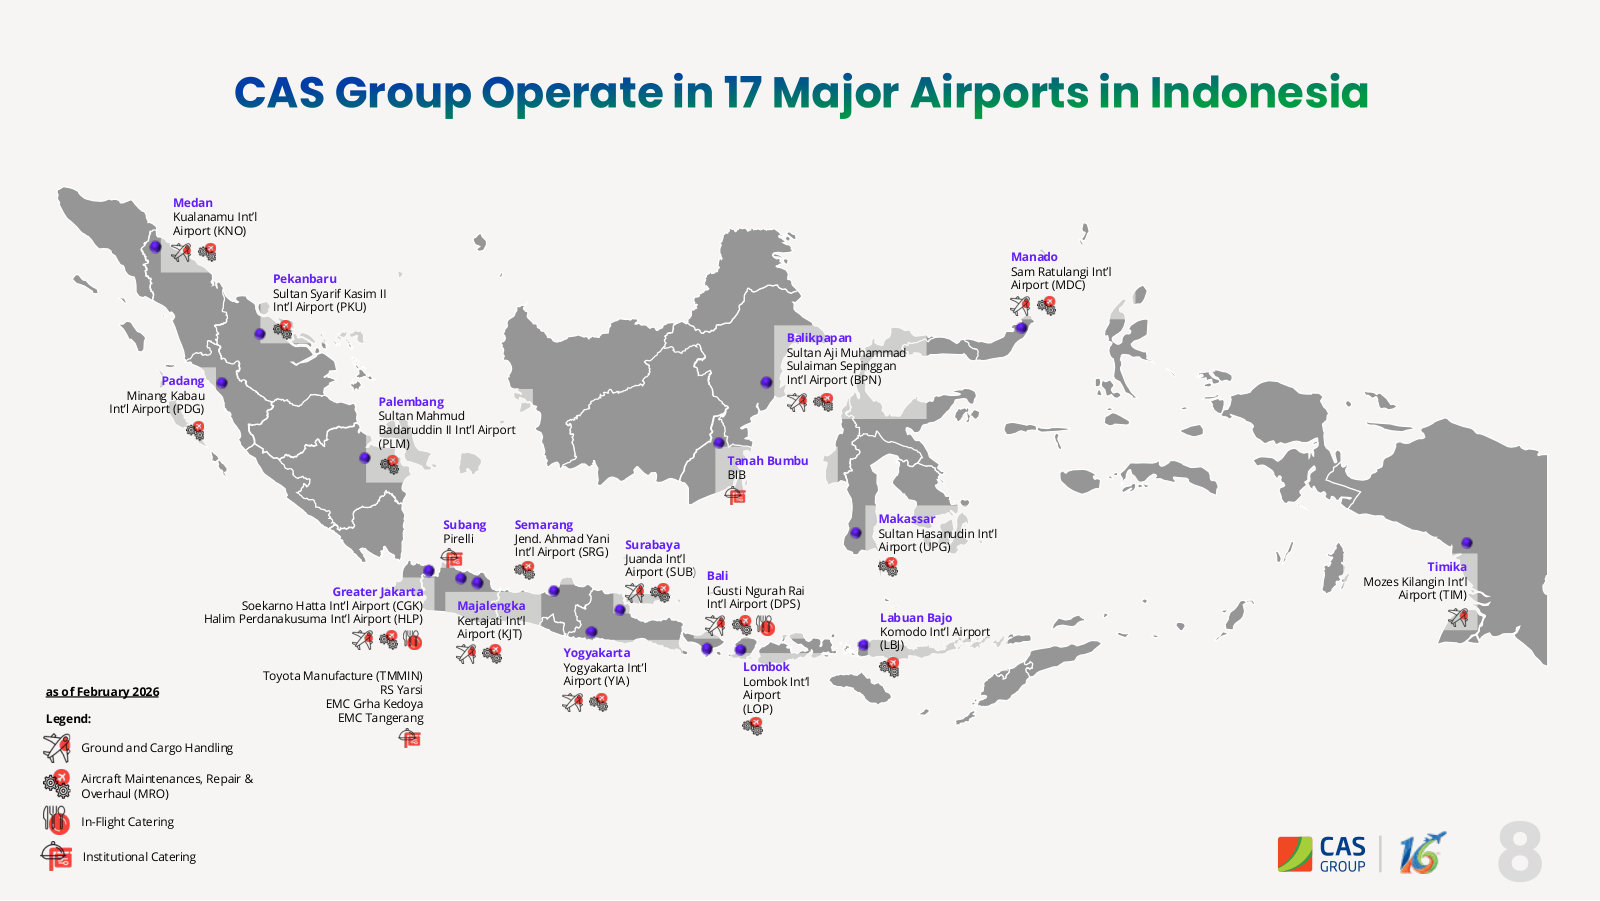
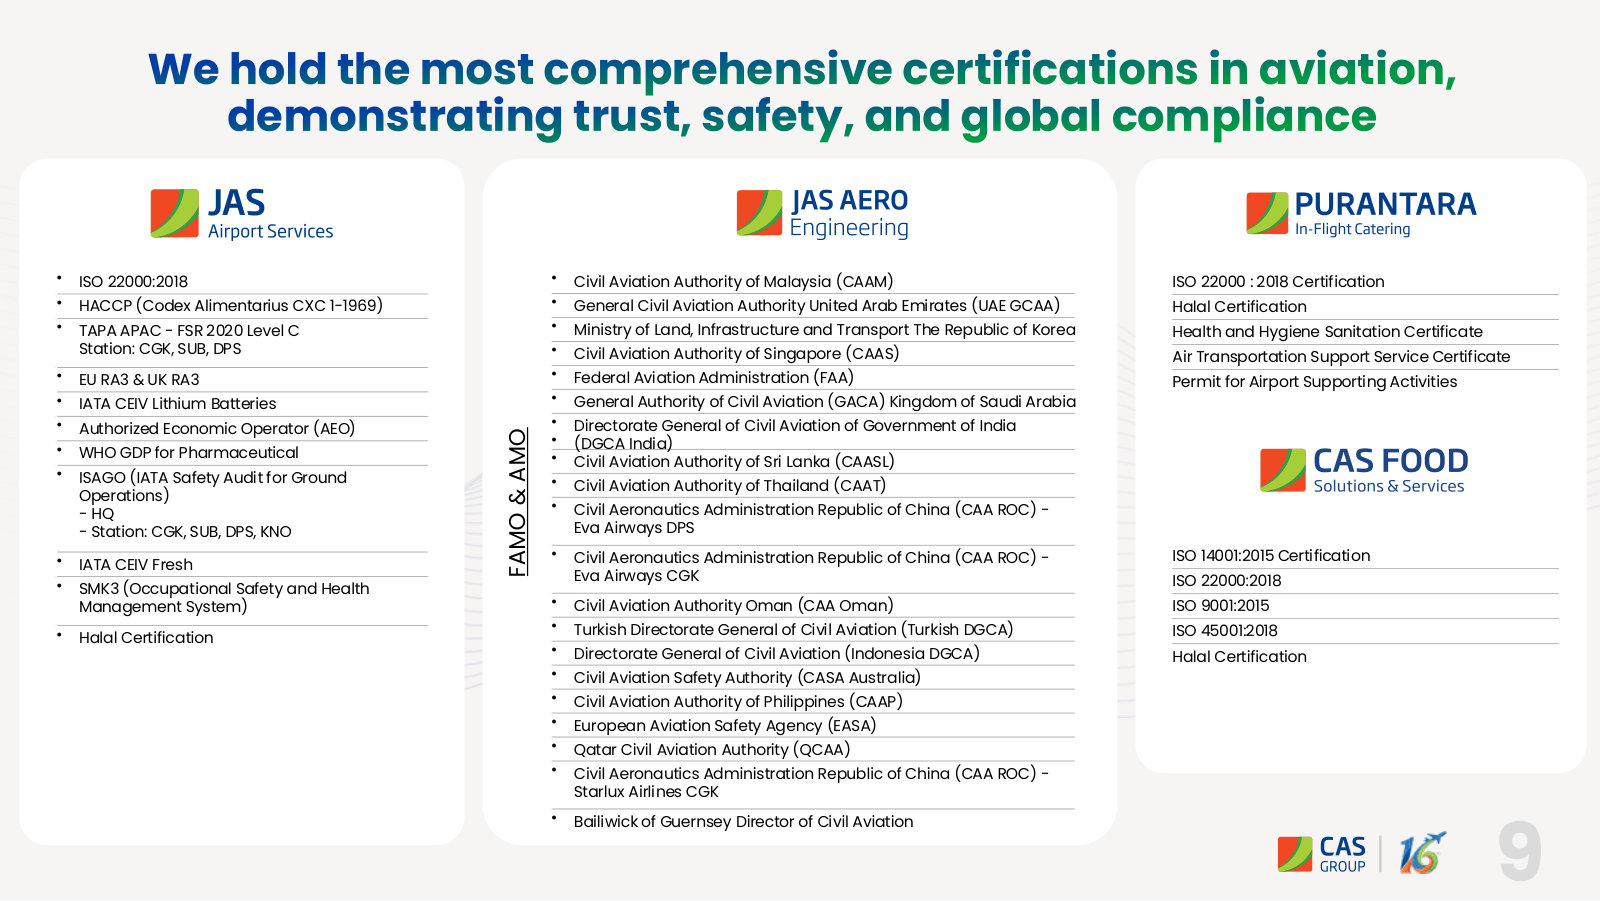
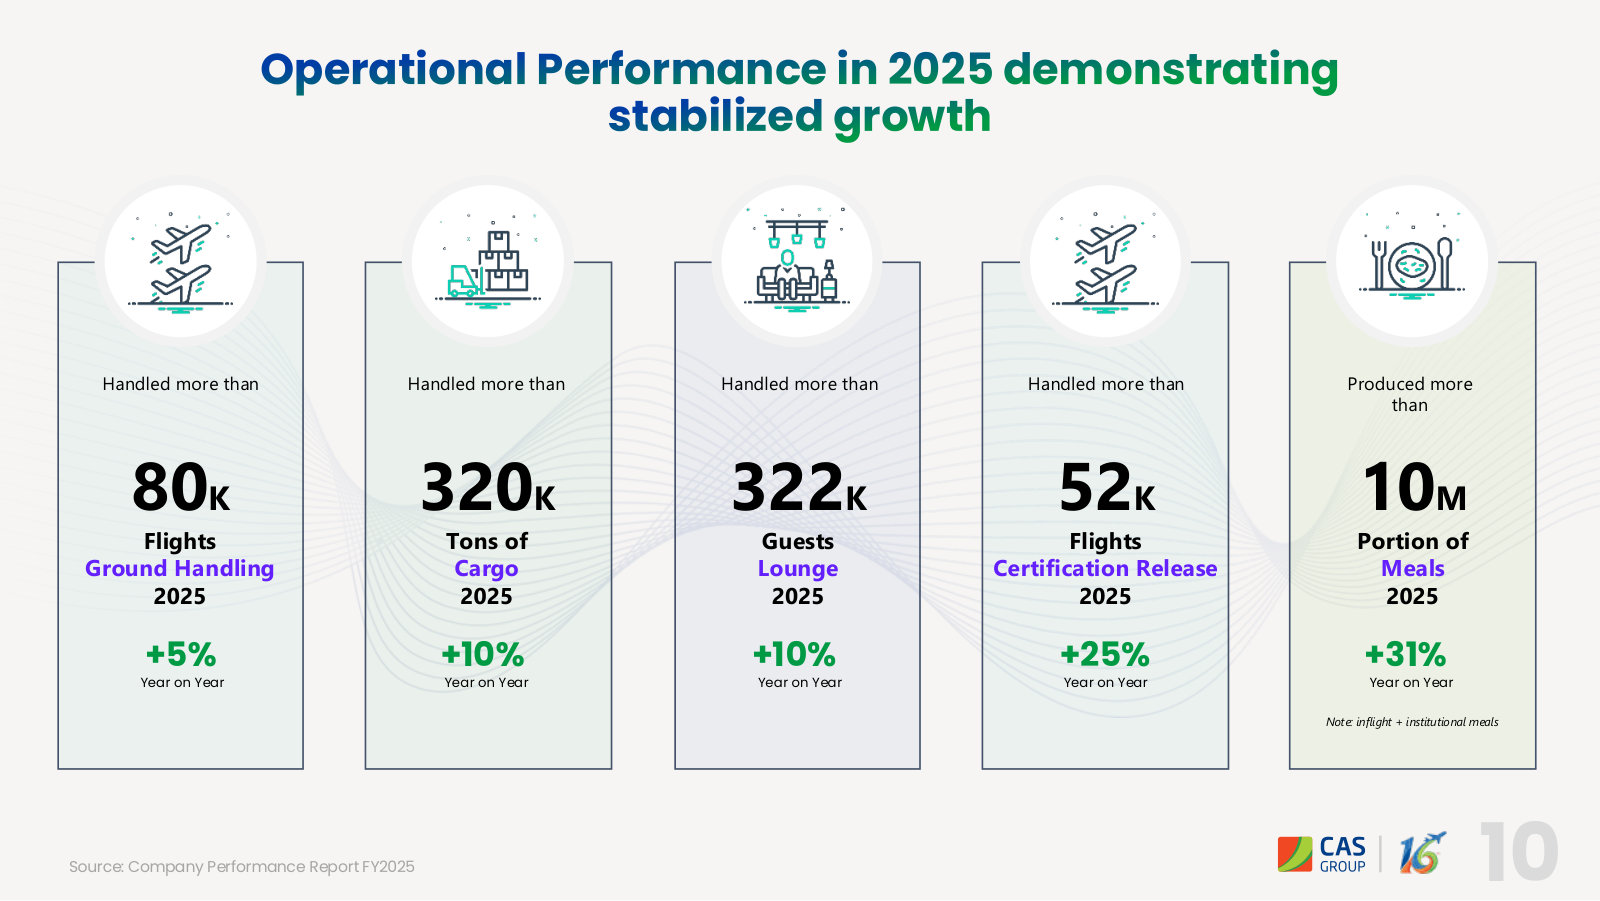
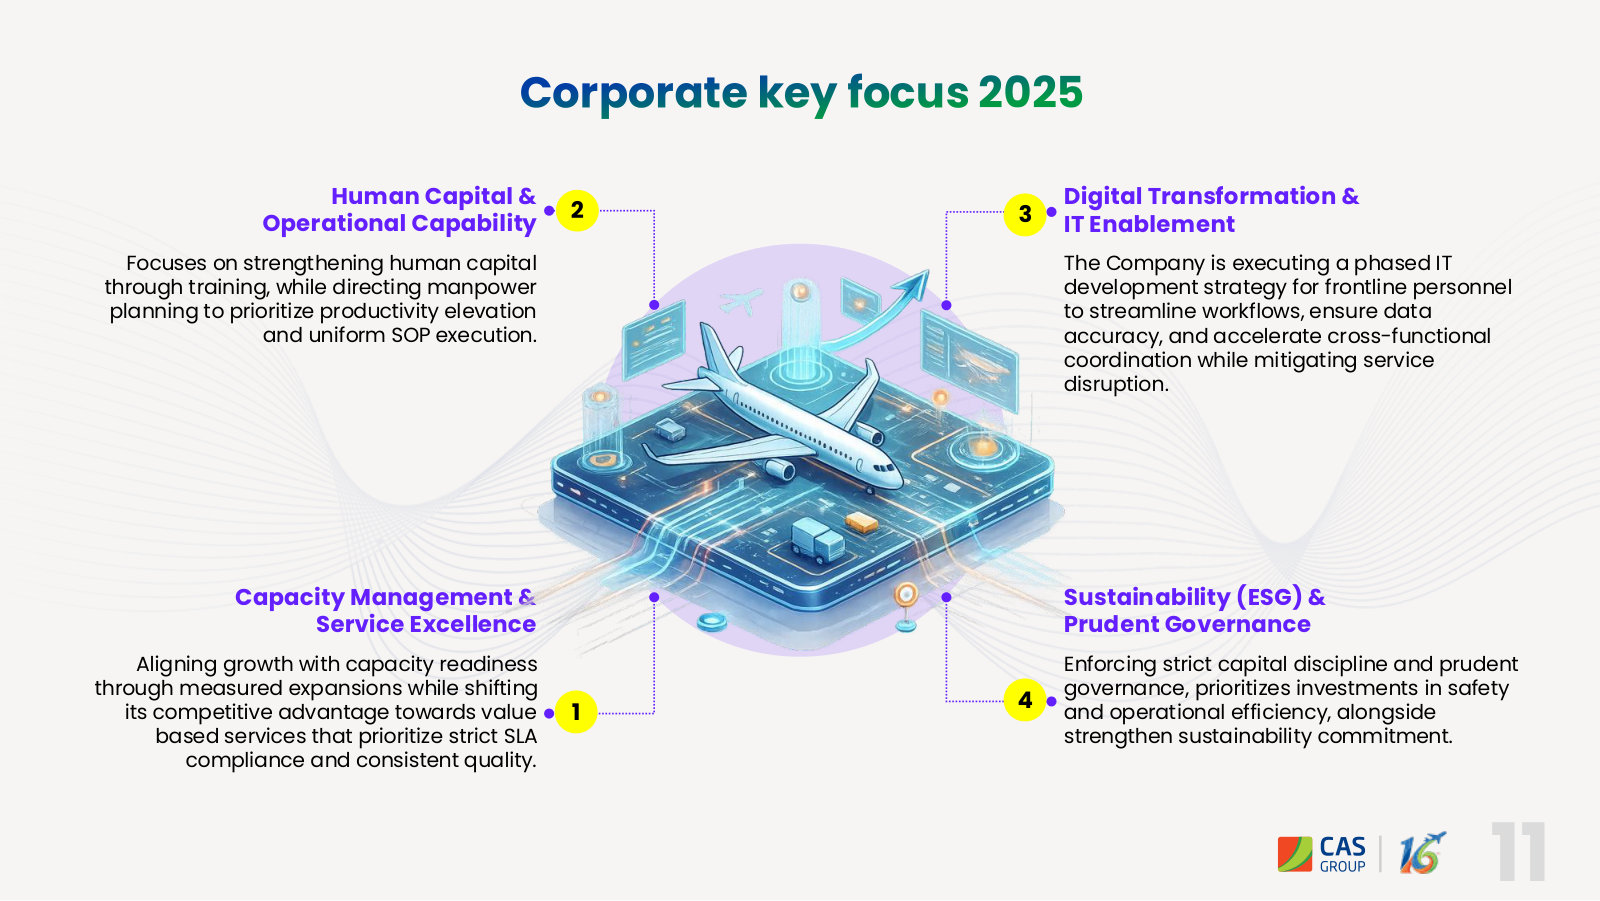
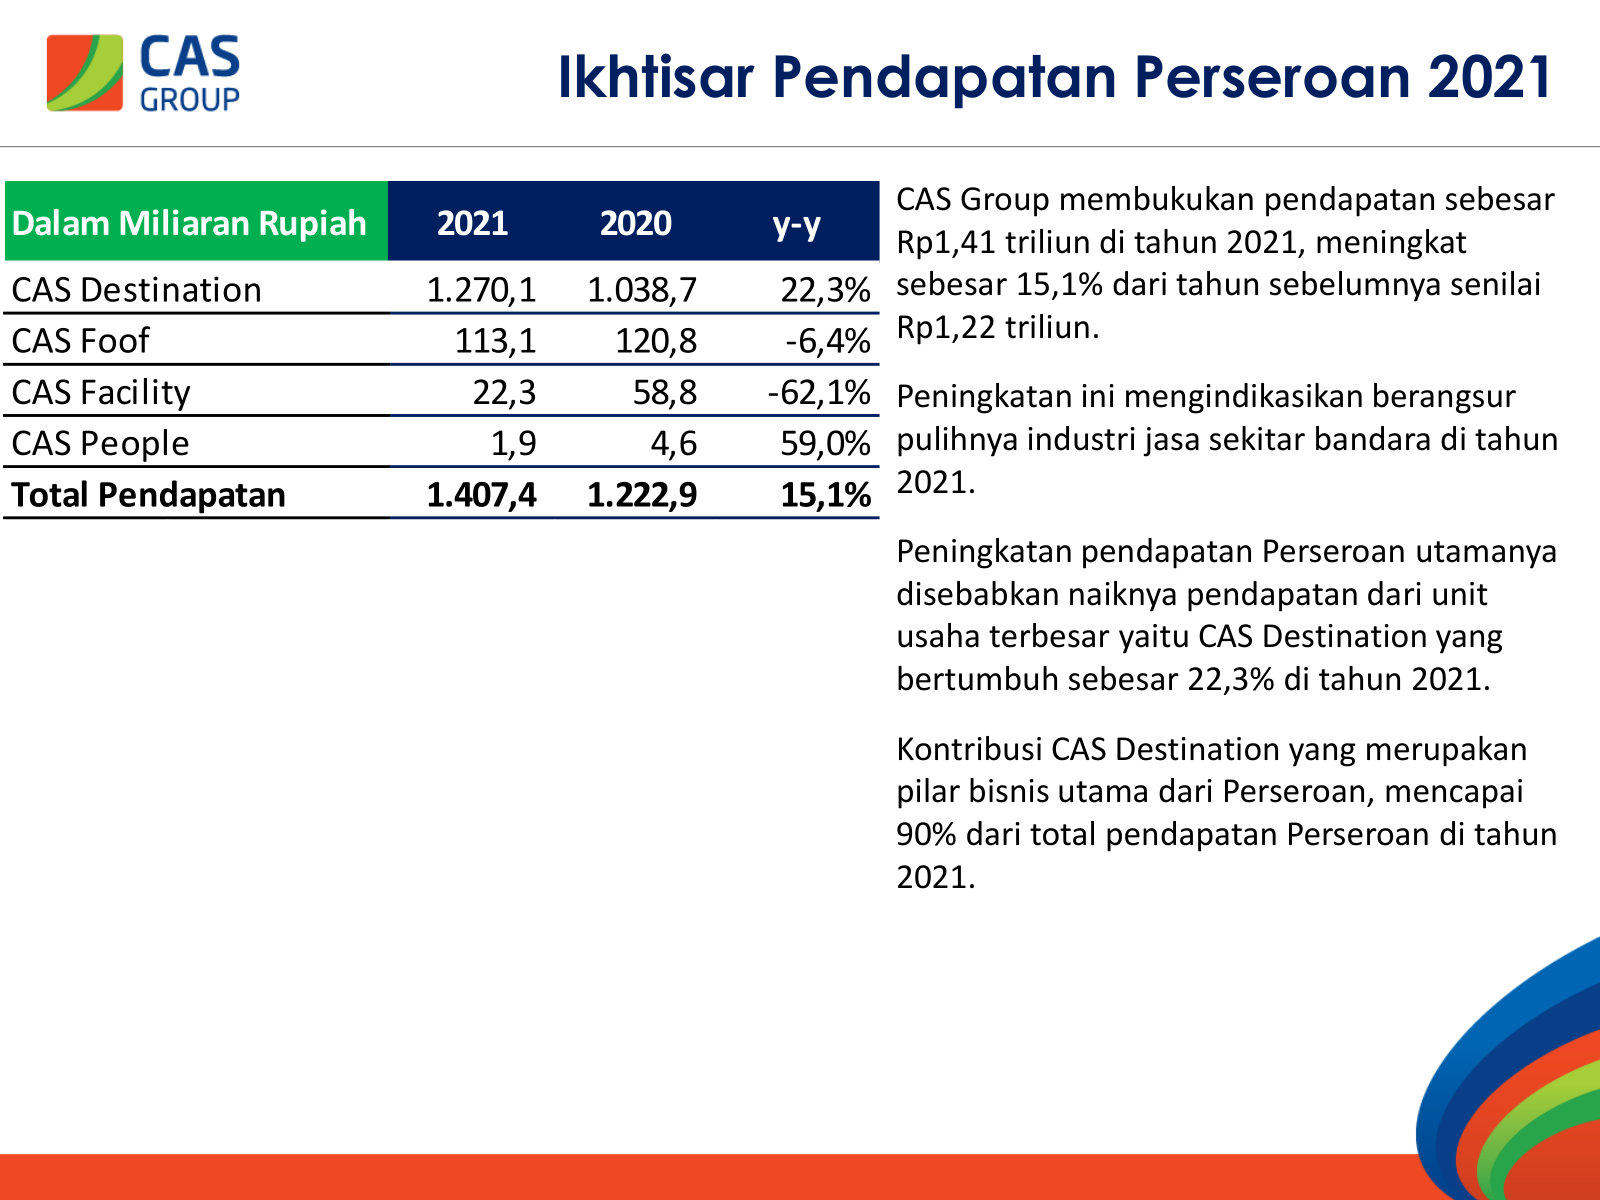
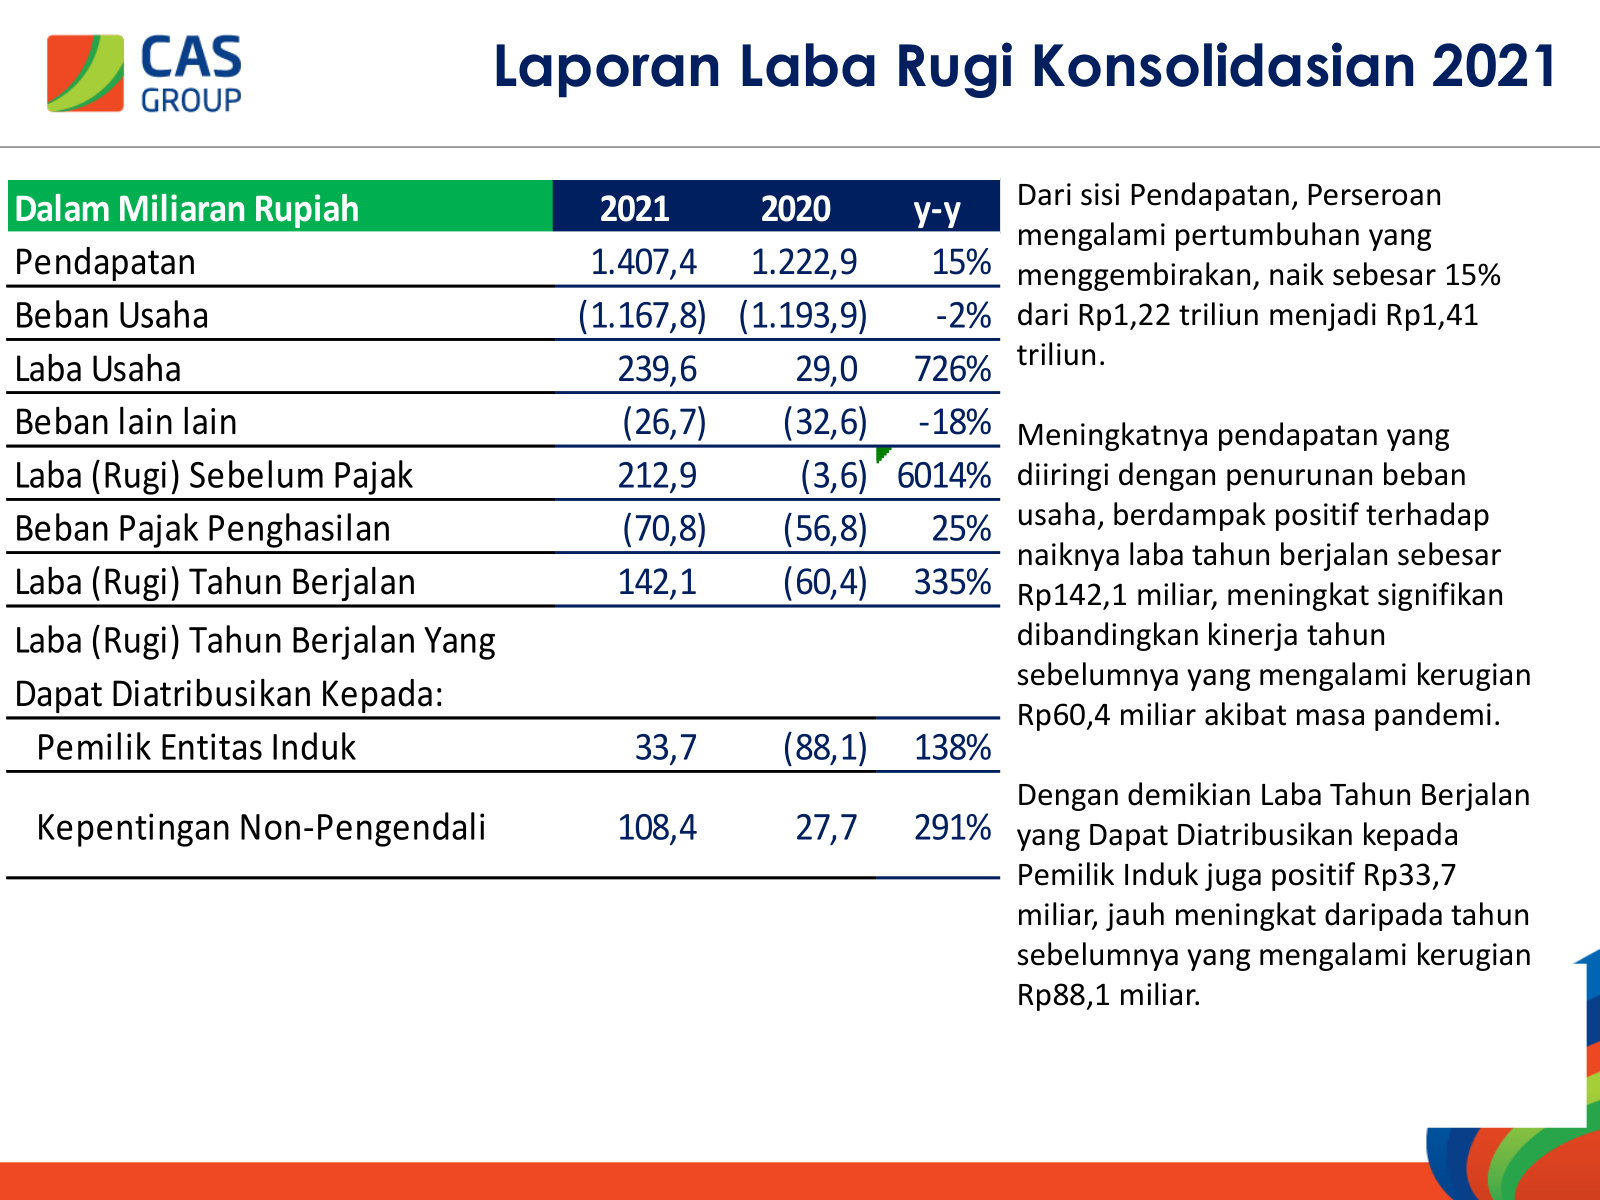
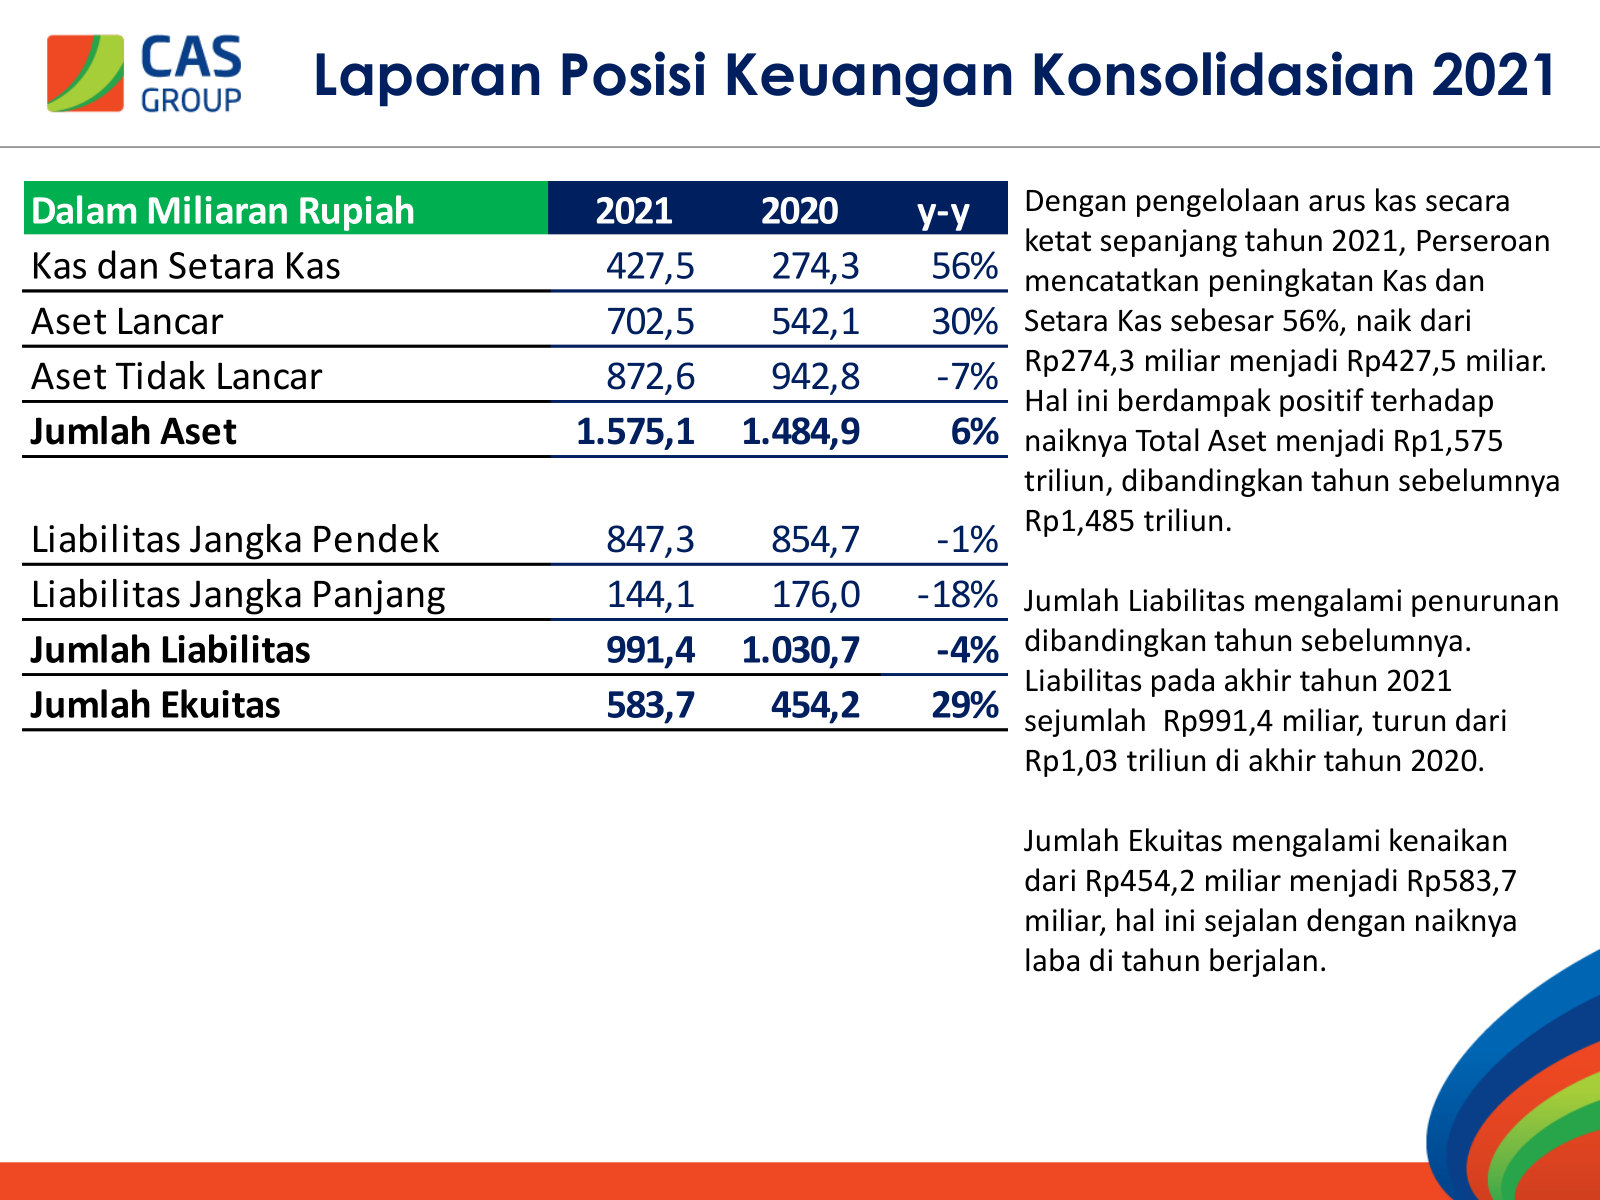
Annual General Meeting Presentation — FY2021 — FY2021
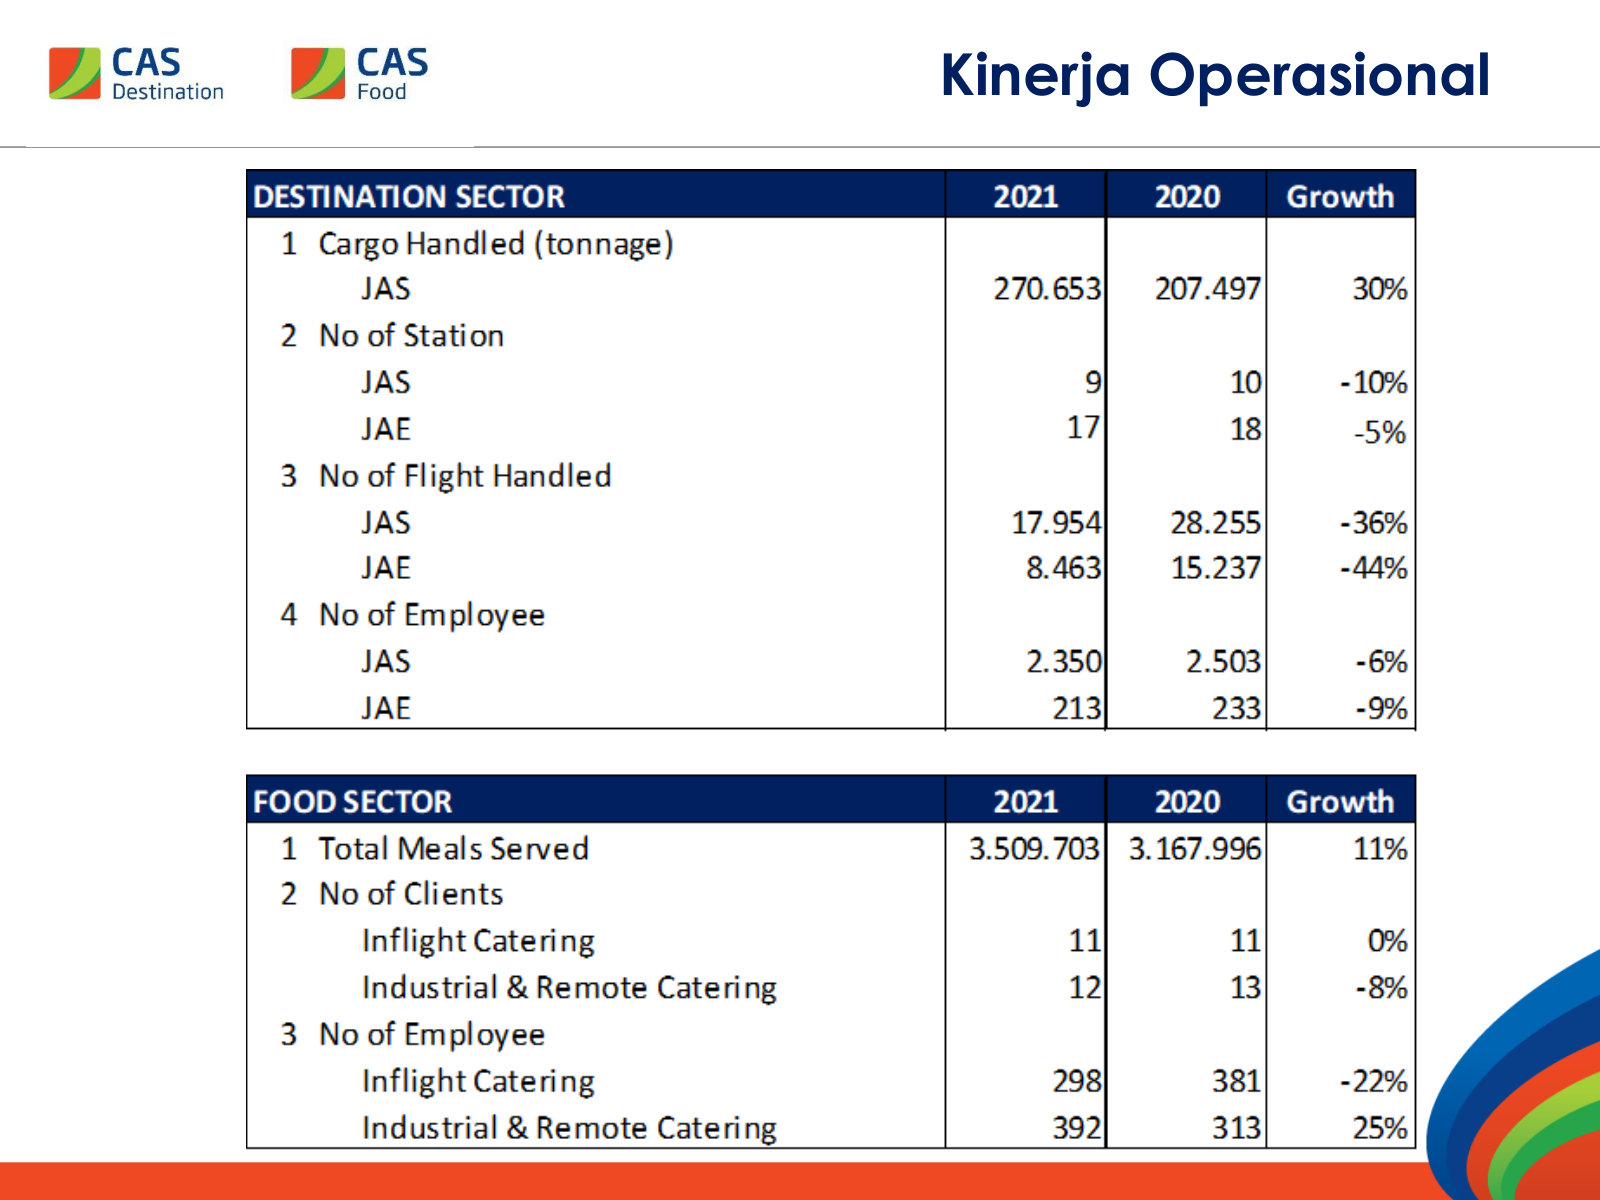
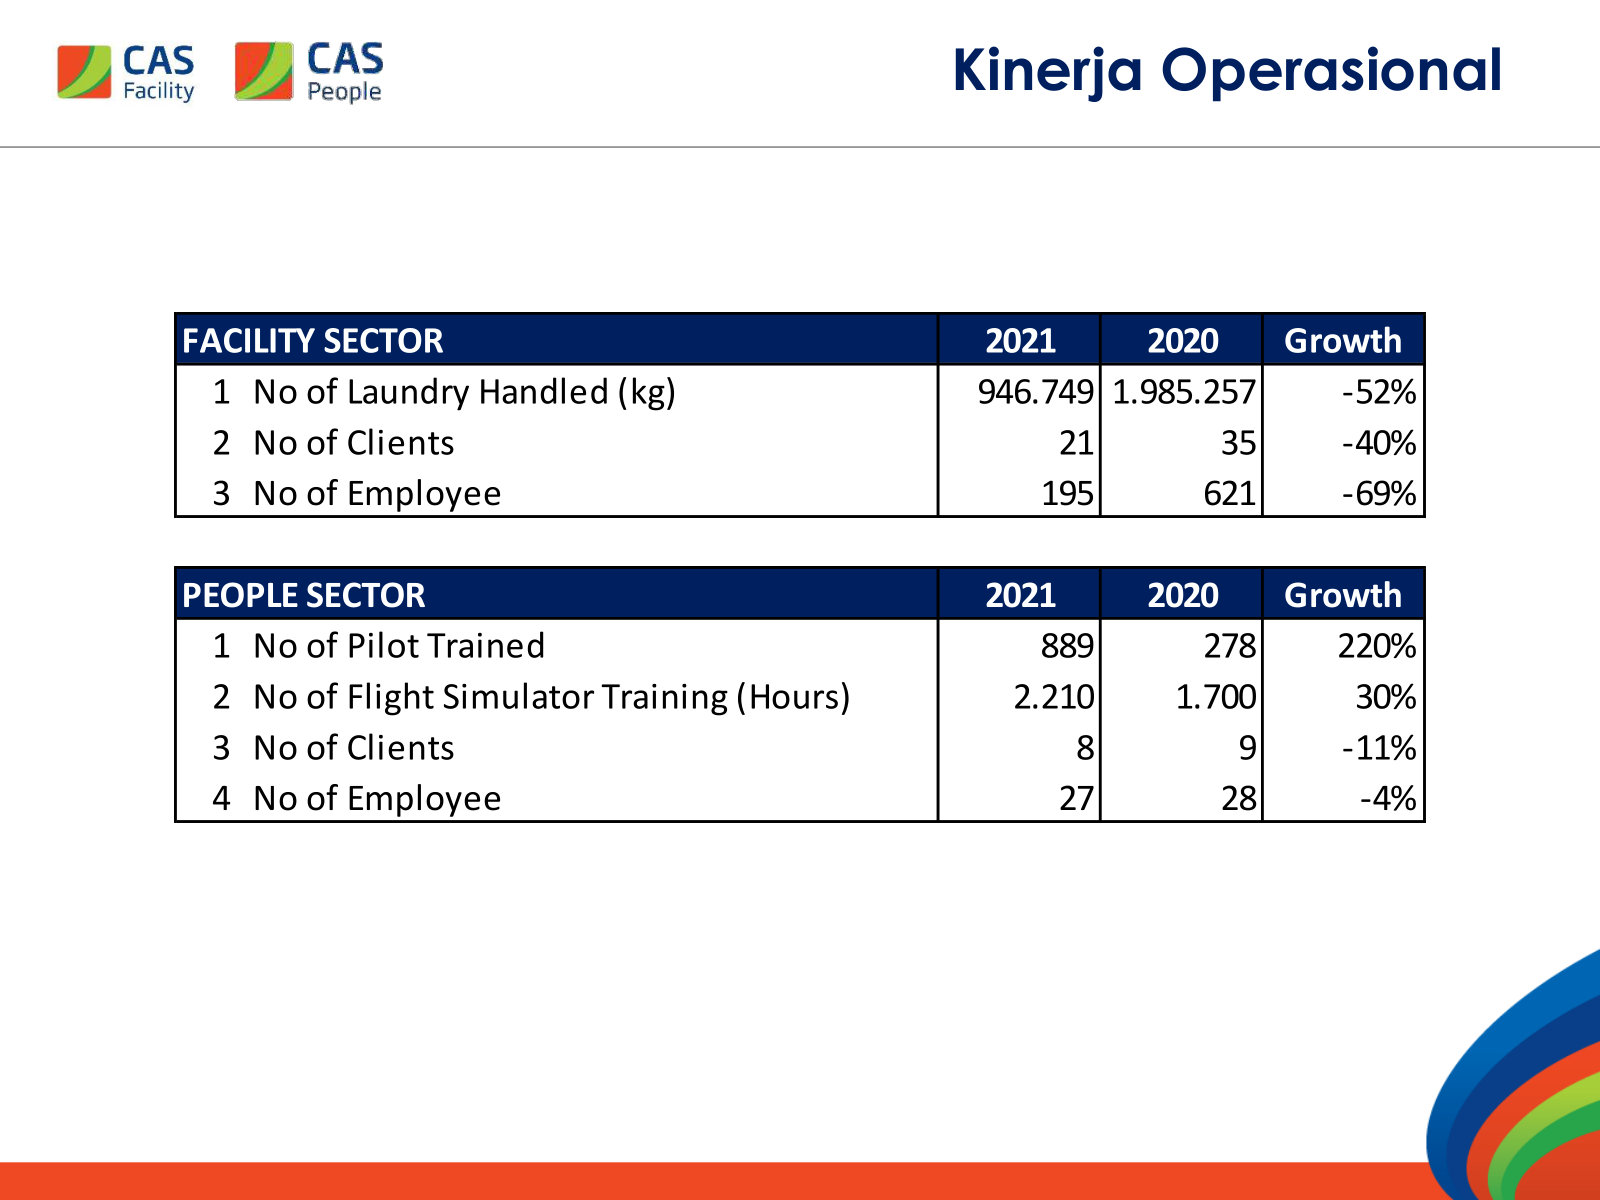
Indonesian-language AGM deck, and the only document in the corpus that breaks revenue and operating metrics out by business segment. · Open the full document →
Annual General Meeting Presentation — FY2020 — FY2020
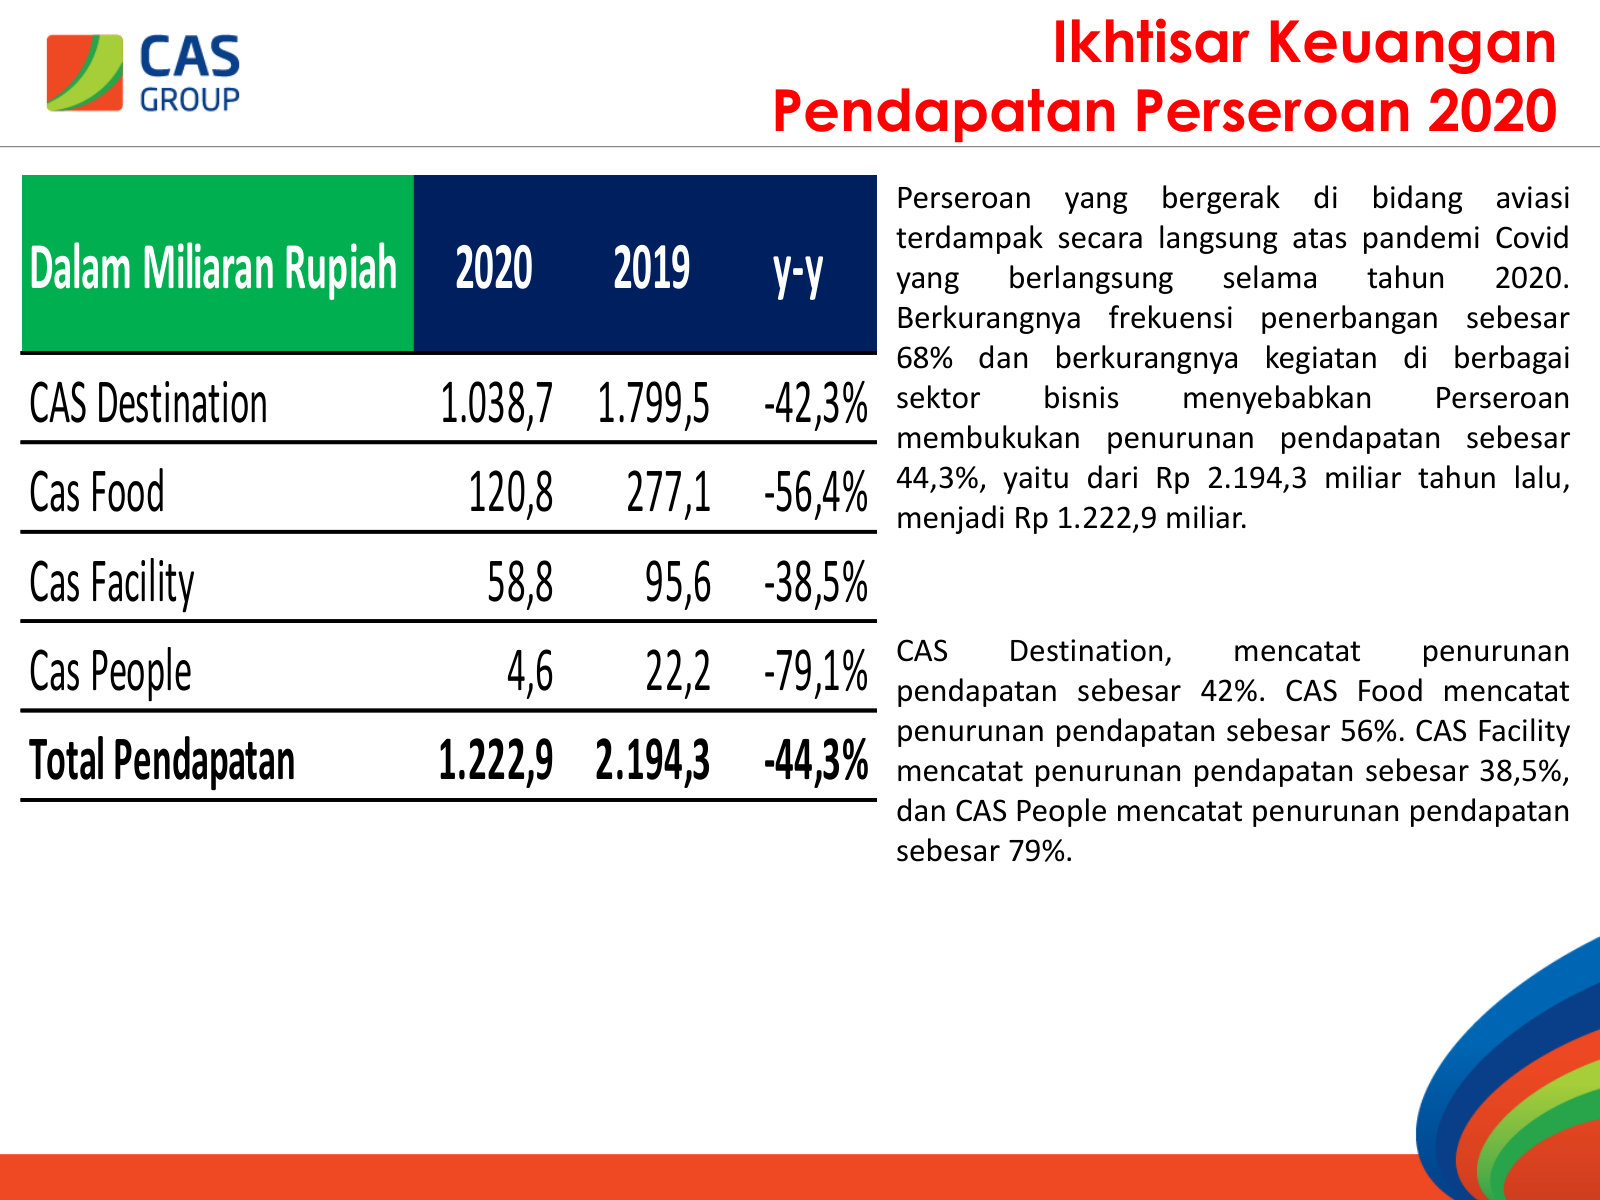
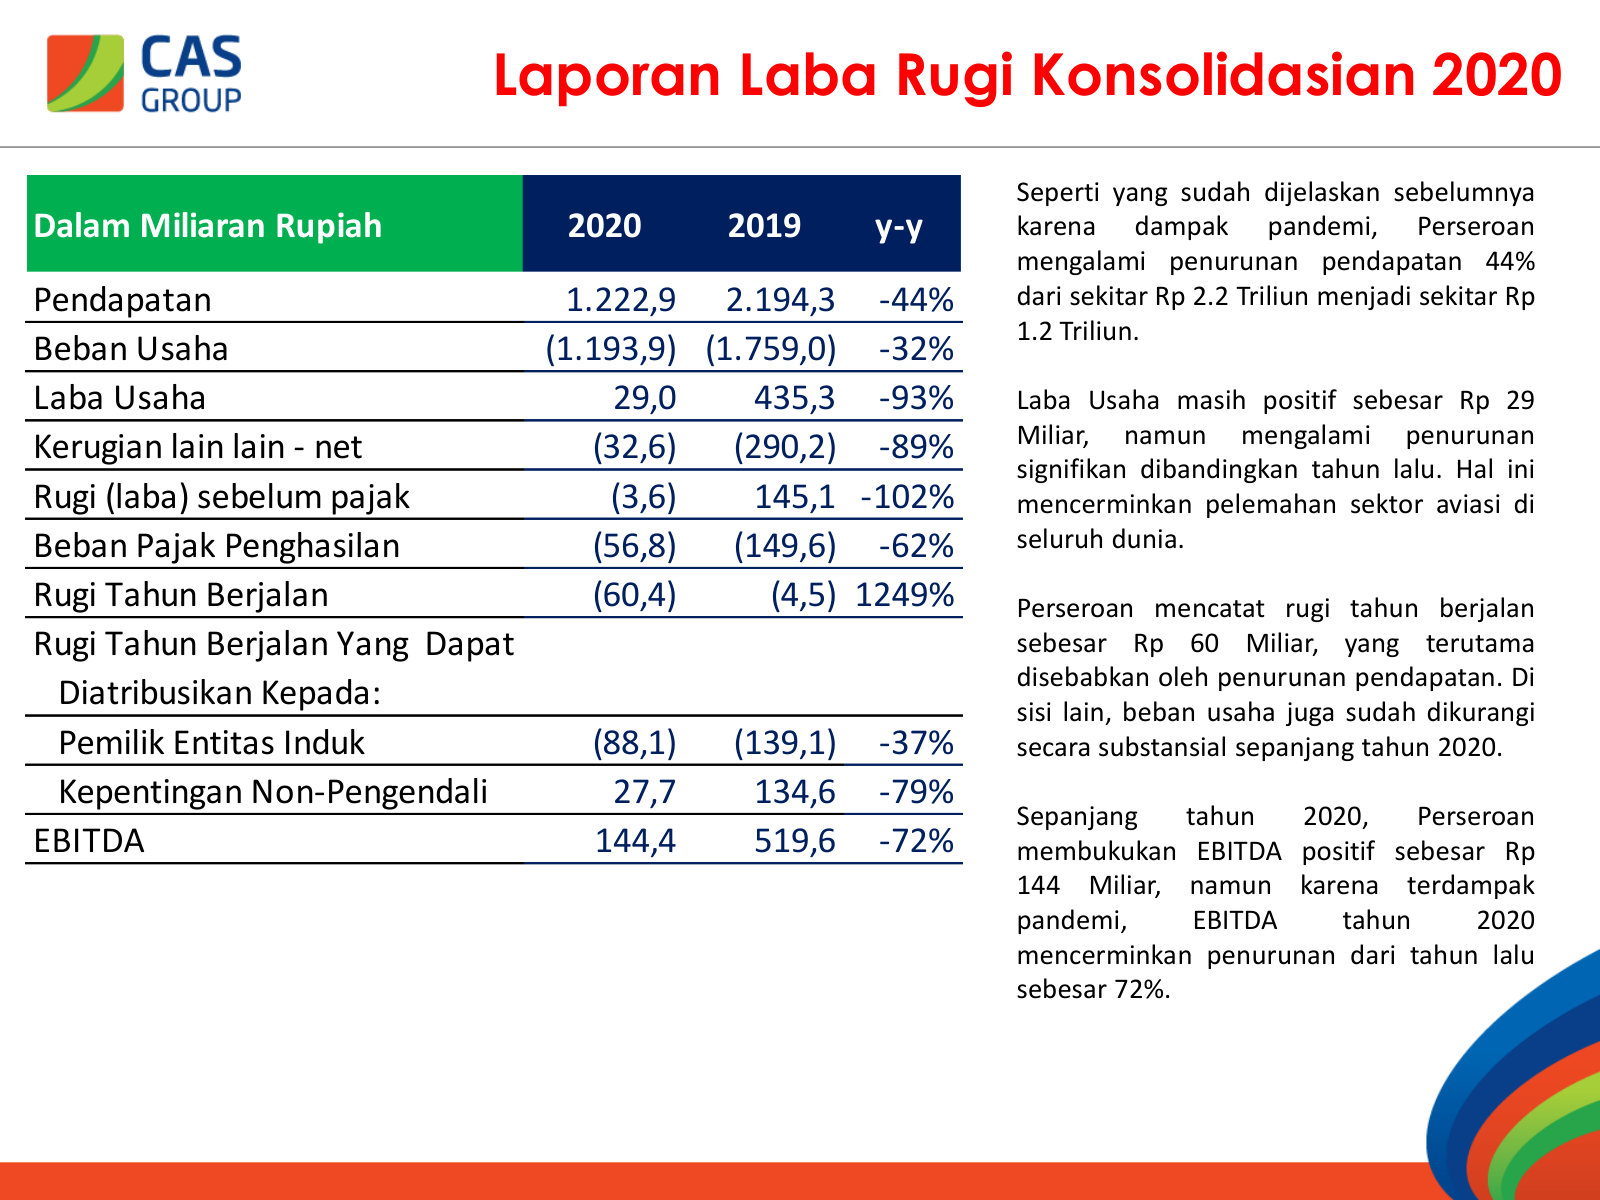
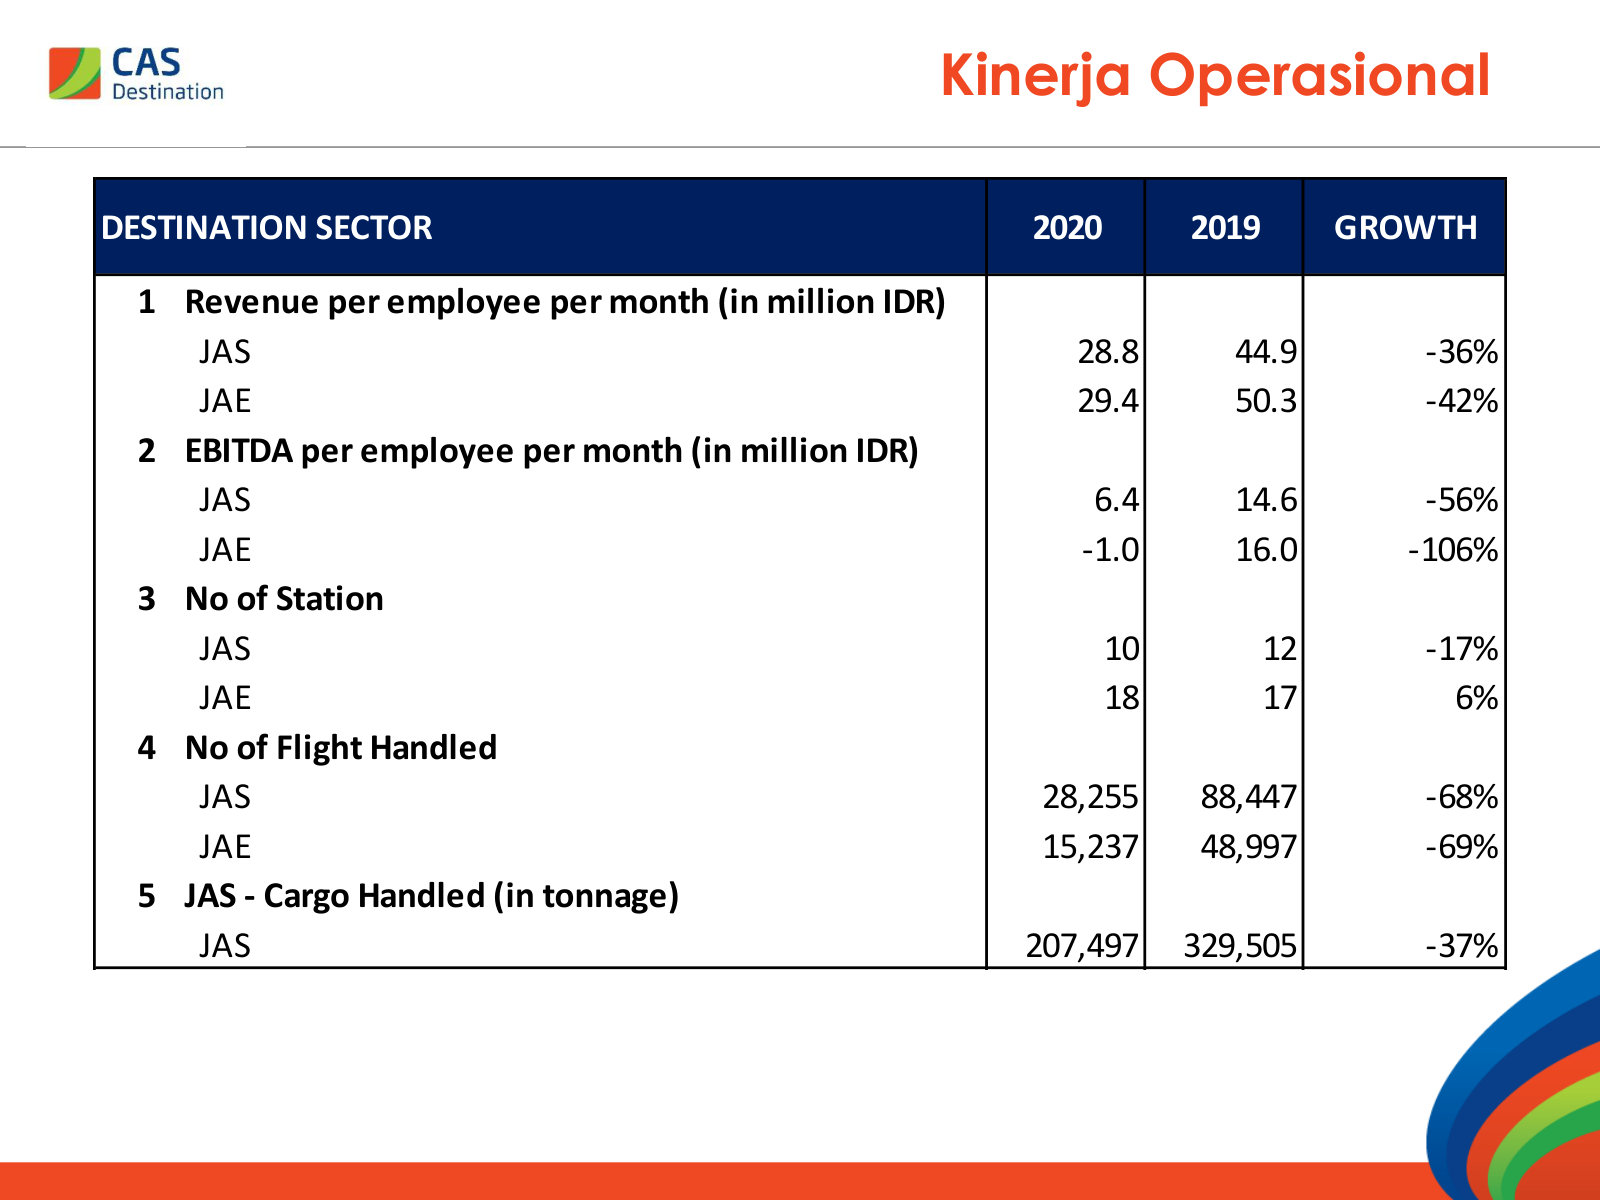
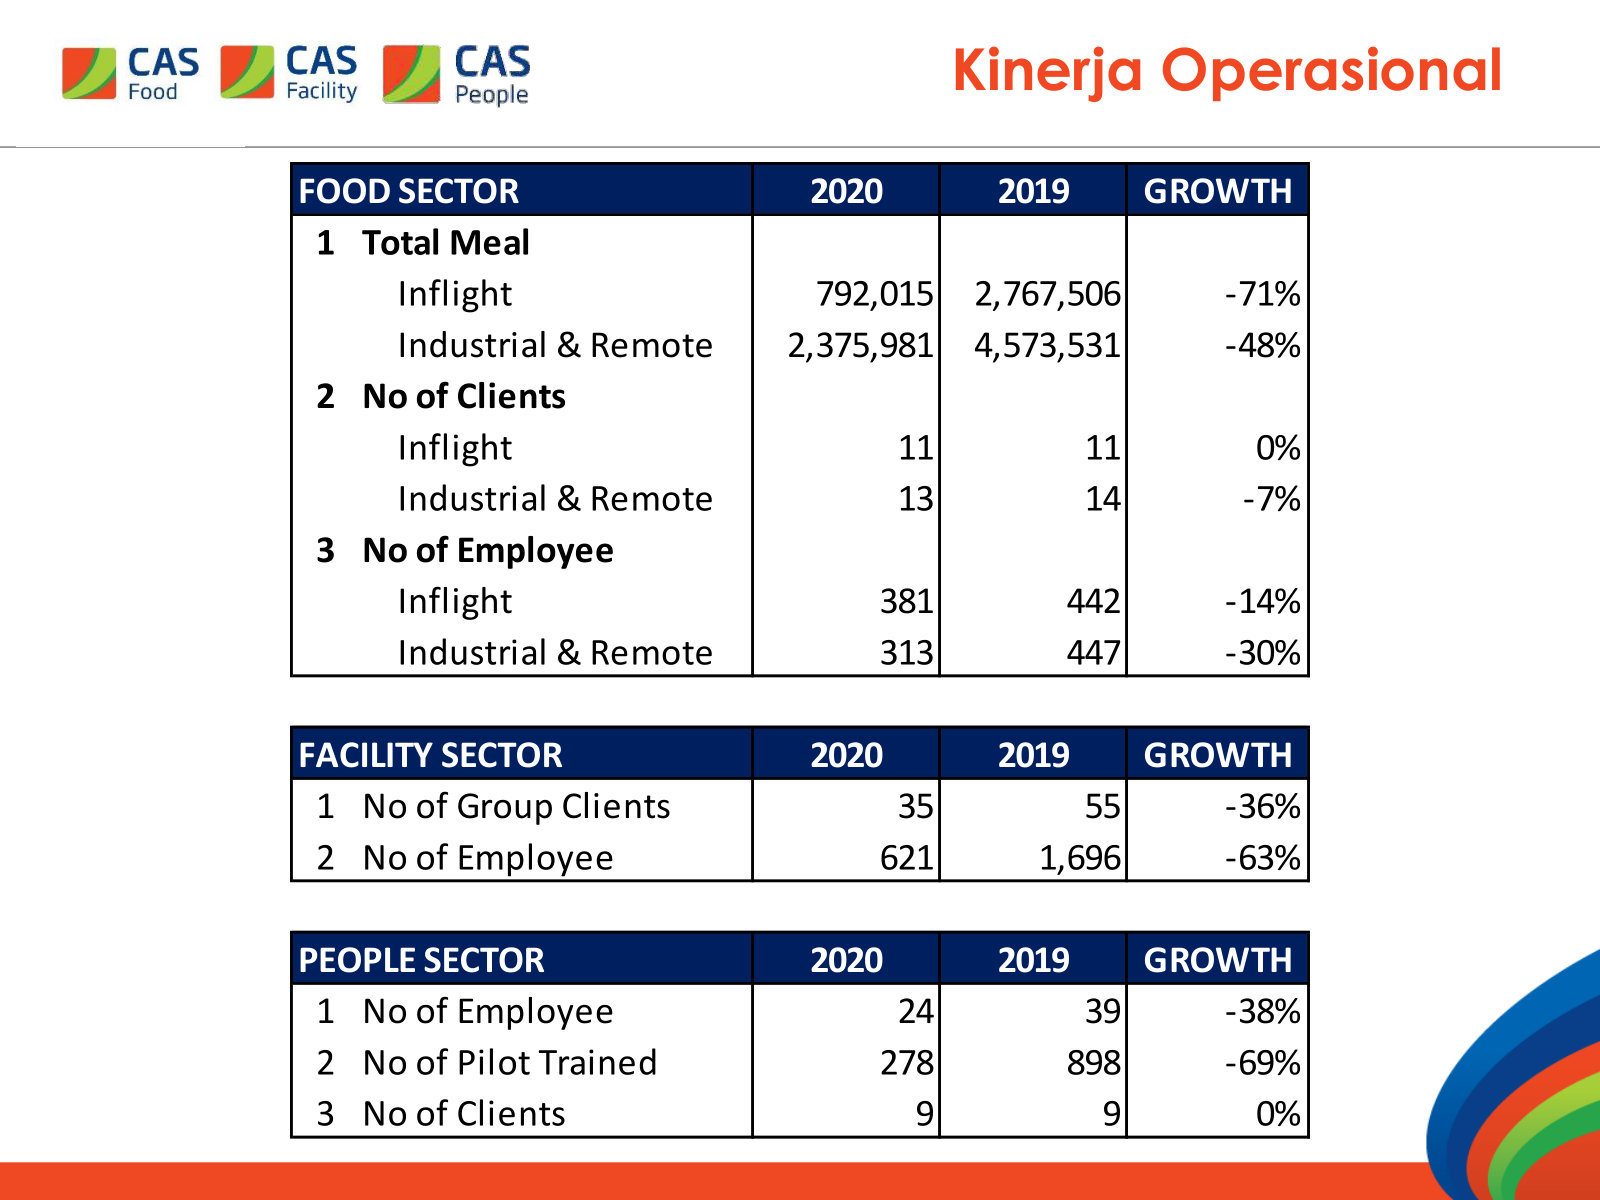
The pandemic-trough deck. Worth four slides because it carries the 2019 pre-COVID baseline and per-employee economics side by side. · Open the full document →
More from management
FY2024 Annual General Meeting — Agenda and Explanations — FY2024 · 13 pages · The first AGM under EMTEK control: agenda and explanations for the FY2024 accounts, profit appropriation and auditor appointment. · Open →
Extraordinary General Meeting — April 2025 — 2025 · 5 pages · Where the rename from Cardig Aero Services to Cahaya Aero Services was put to shareholders. · Open →
Extraordinary General Meeting — June 2024 — 2024 · 5 pages · The board reconstitution two months after EMTEK bought control — who the new owner installed. · Open →
Extraordinary General Meeting — July 2022 — 2022 · 15 pages · SATS executives joining the board, with bios — what governance looked like before EMTEK arrived. · Open →
FY2019 Annual General Meeting Presentation — FY2019 · 56 pages · The last fully pre-COVID year: Rp2.19tn of revenue and the operating volumes that went with it. · Open →
PT Cahaya Aero Services Tbk's annual reports contain management's most considered account of the business. These are the sections, passages and visual pages worth opening in the originals preserved in Sources.
PT Cahaya Aero Services Tbk — FY2025 Annual Report — FY2025
Management's fullest account of the first full year under EMTEK control — new name, redrawn segments, and a candid forward risk. · Open the full document →
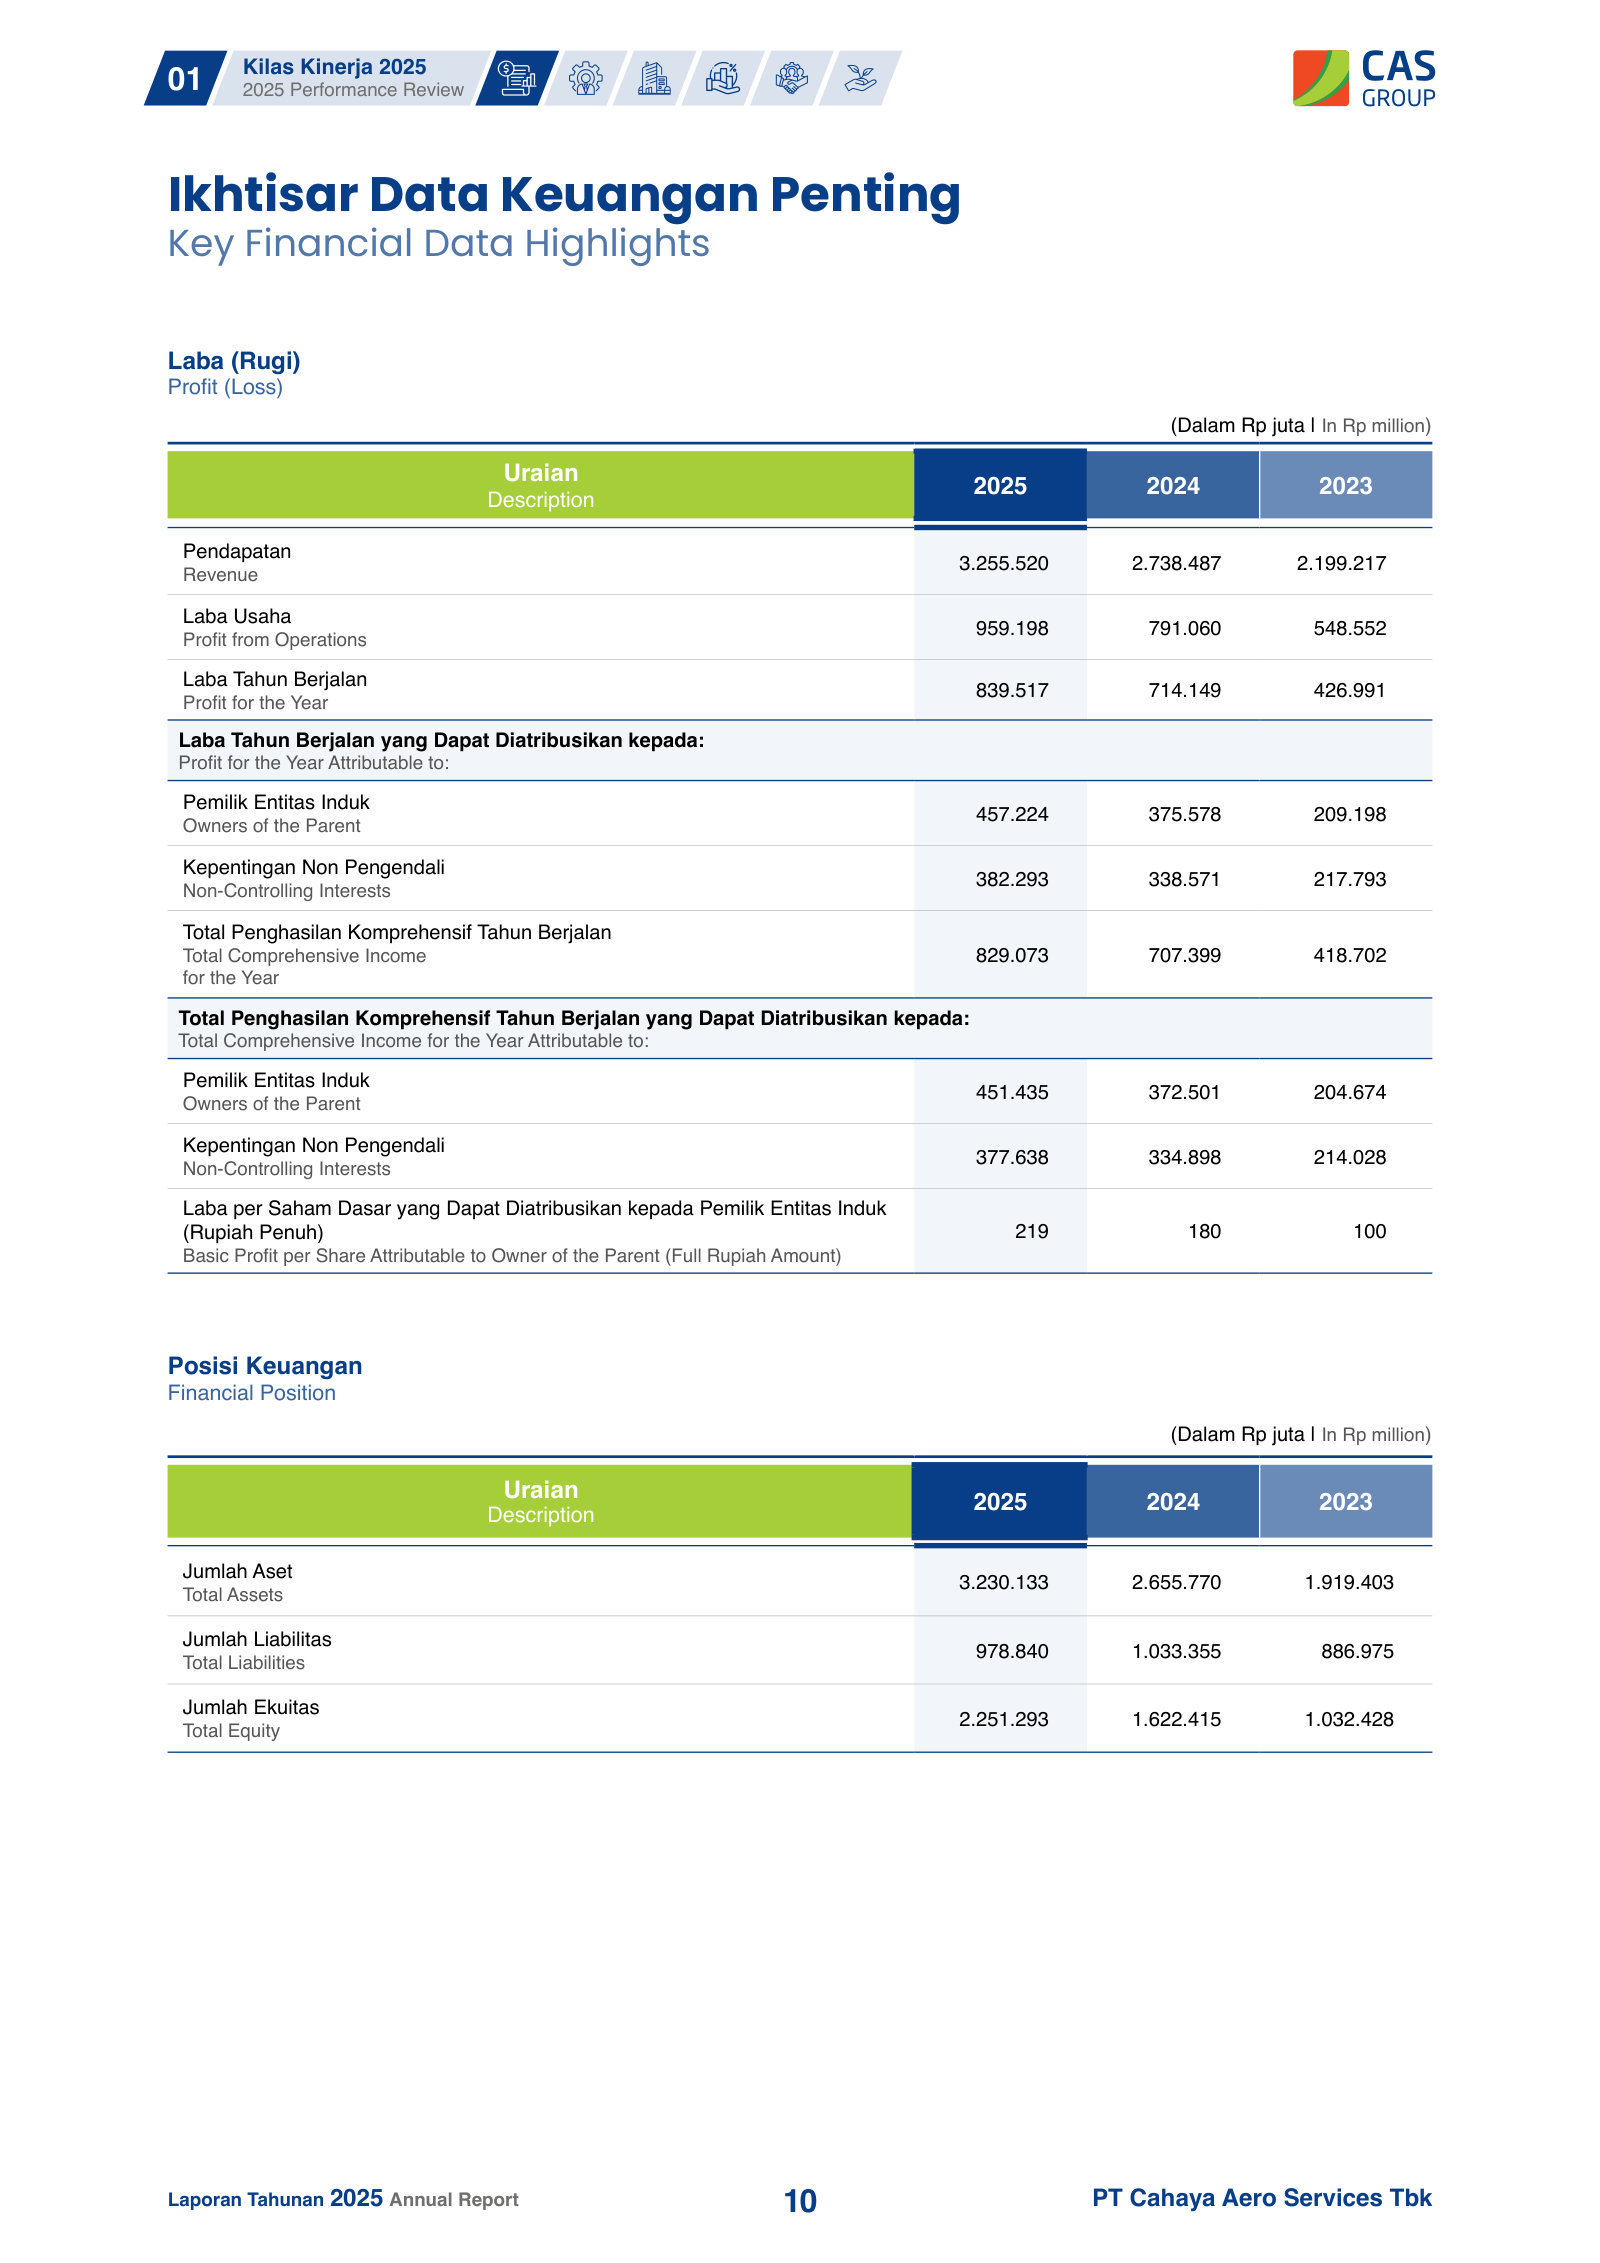
Ikhtisar Data Keuangan Penting / Key Financial Data Highlights — p. 10 · Read the full section →
Three-year P&L, margins and cash flow on two pages — the numbers behind the story, at a glance.
Riwayat Singkat Perseroan / Brief History of the Company — p. 48 · Read the full section →
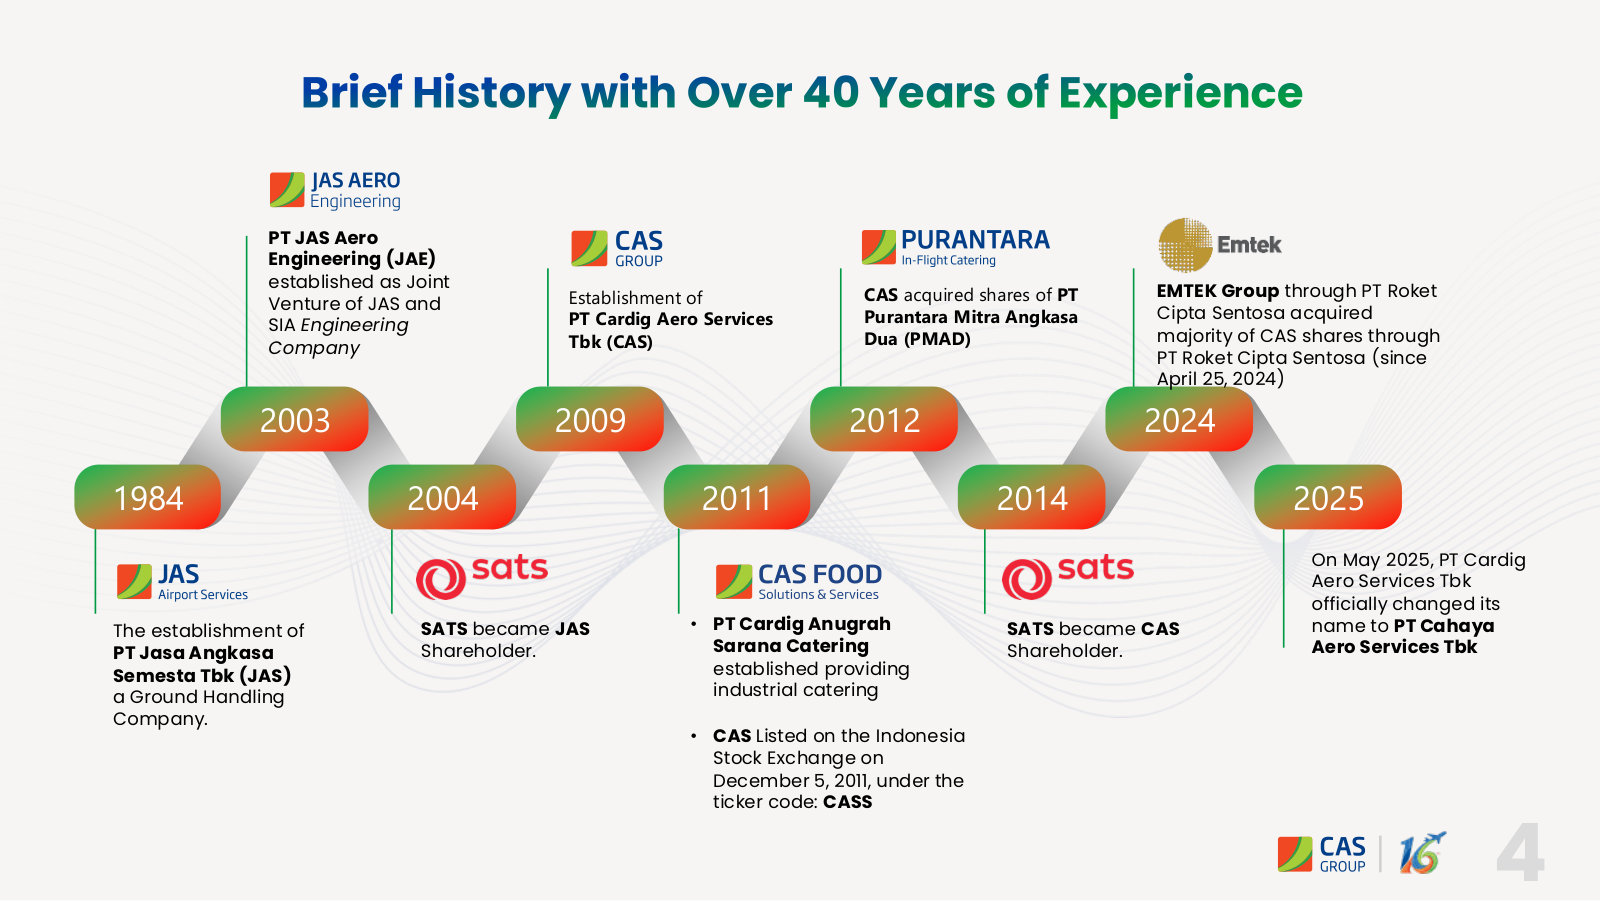
How a 1973 JAS ground-handling business passed from SATS to EMTEK control and became Cahaya Aero Services.
EMTEK's PT Roket Cipta Sentosa lifts its stake to 61% and renames the company in 2025.
On April 25, 2024, PT Roket Cipta Sentosa, a subsidiary of PT Elang Mahkota Teknologi Tbk ("EMTEK Group"), acquired 51% of the Company’s shares, making it the new controlling entity.
On April 11, 2025, Cemerlang Pte. Ltd. transferred 10% of its shareholding in the Company to PT Roket Cipta Sentosa, resulting in PT Roket Cipta Sentosa holding 61% of the Company’s shares.
In mid-2025, the Company changed its name from PT Cardig Aero Services Tbk to PT Cahaya Aero Services Tbk pursuant to a resolution of the Extraordinary General Meeting of Shareholders, as set forth in Deed No. 07 dated 25 April 2025 and changed its domicile from East Jakarta to Tangerang City.
p. 49 · Read in context →
Informasi Pemegang Saham Utama / Information of Majority Shareholder — p. 78 · Read the full section →
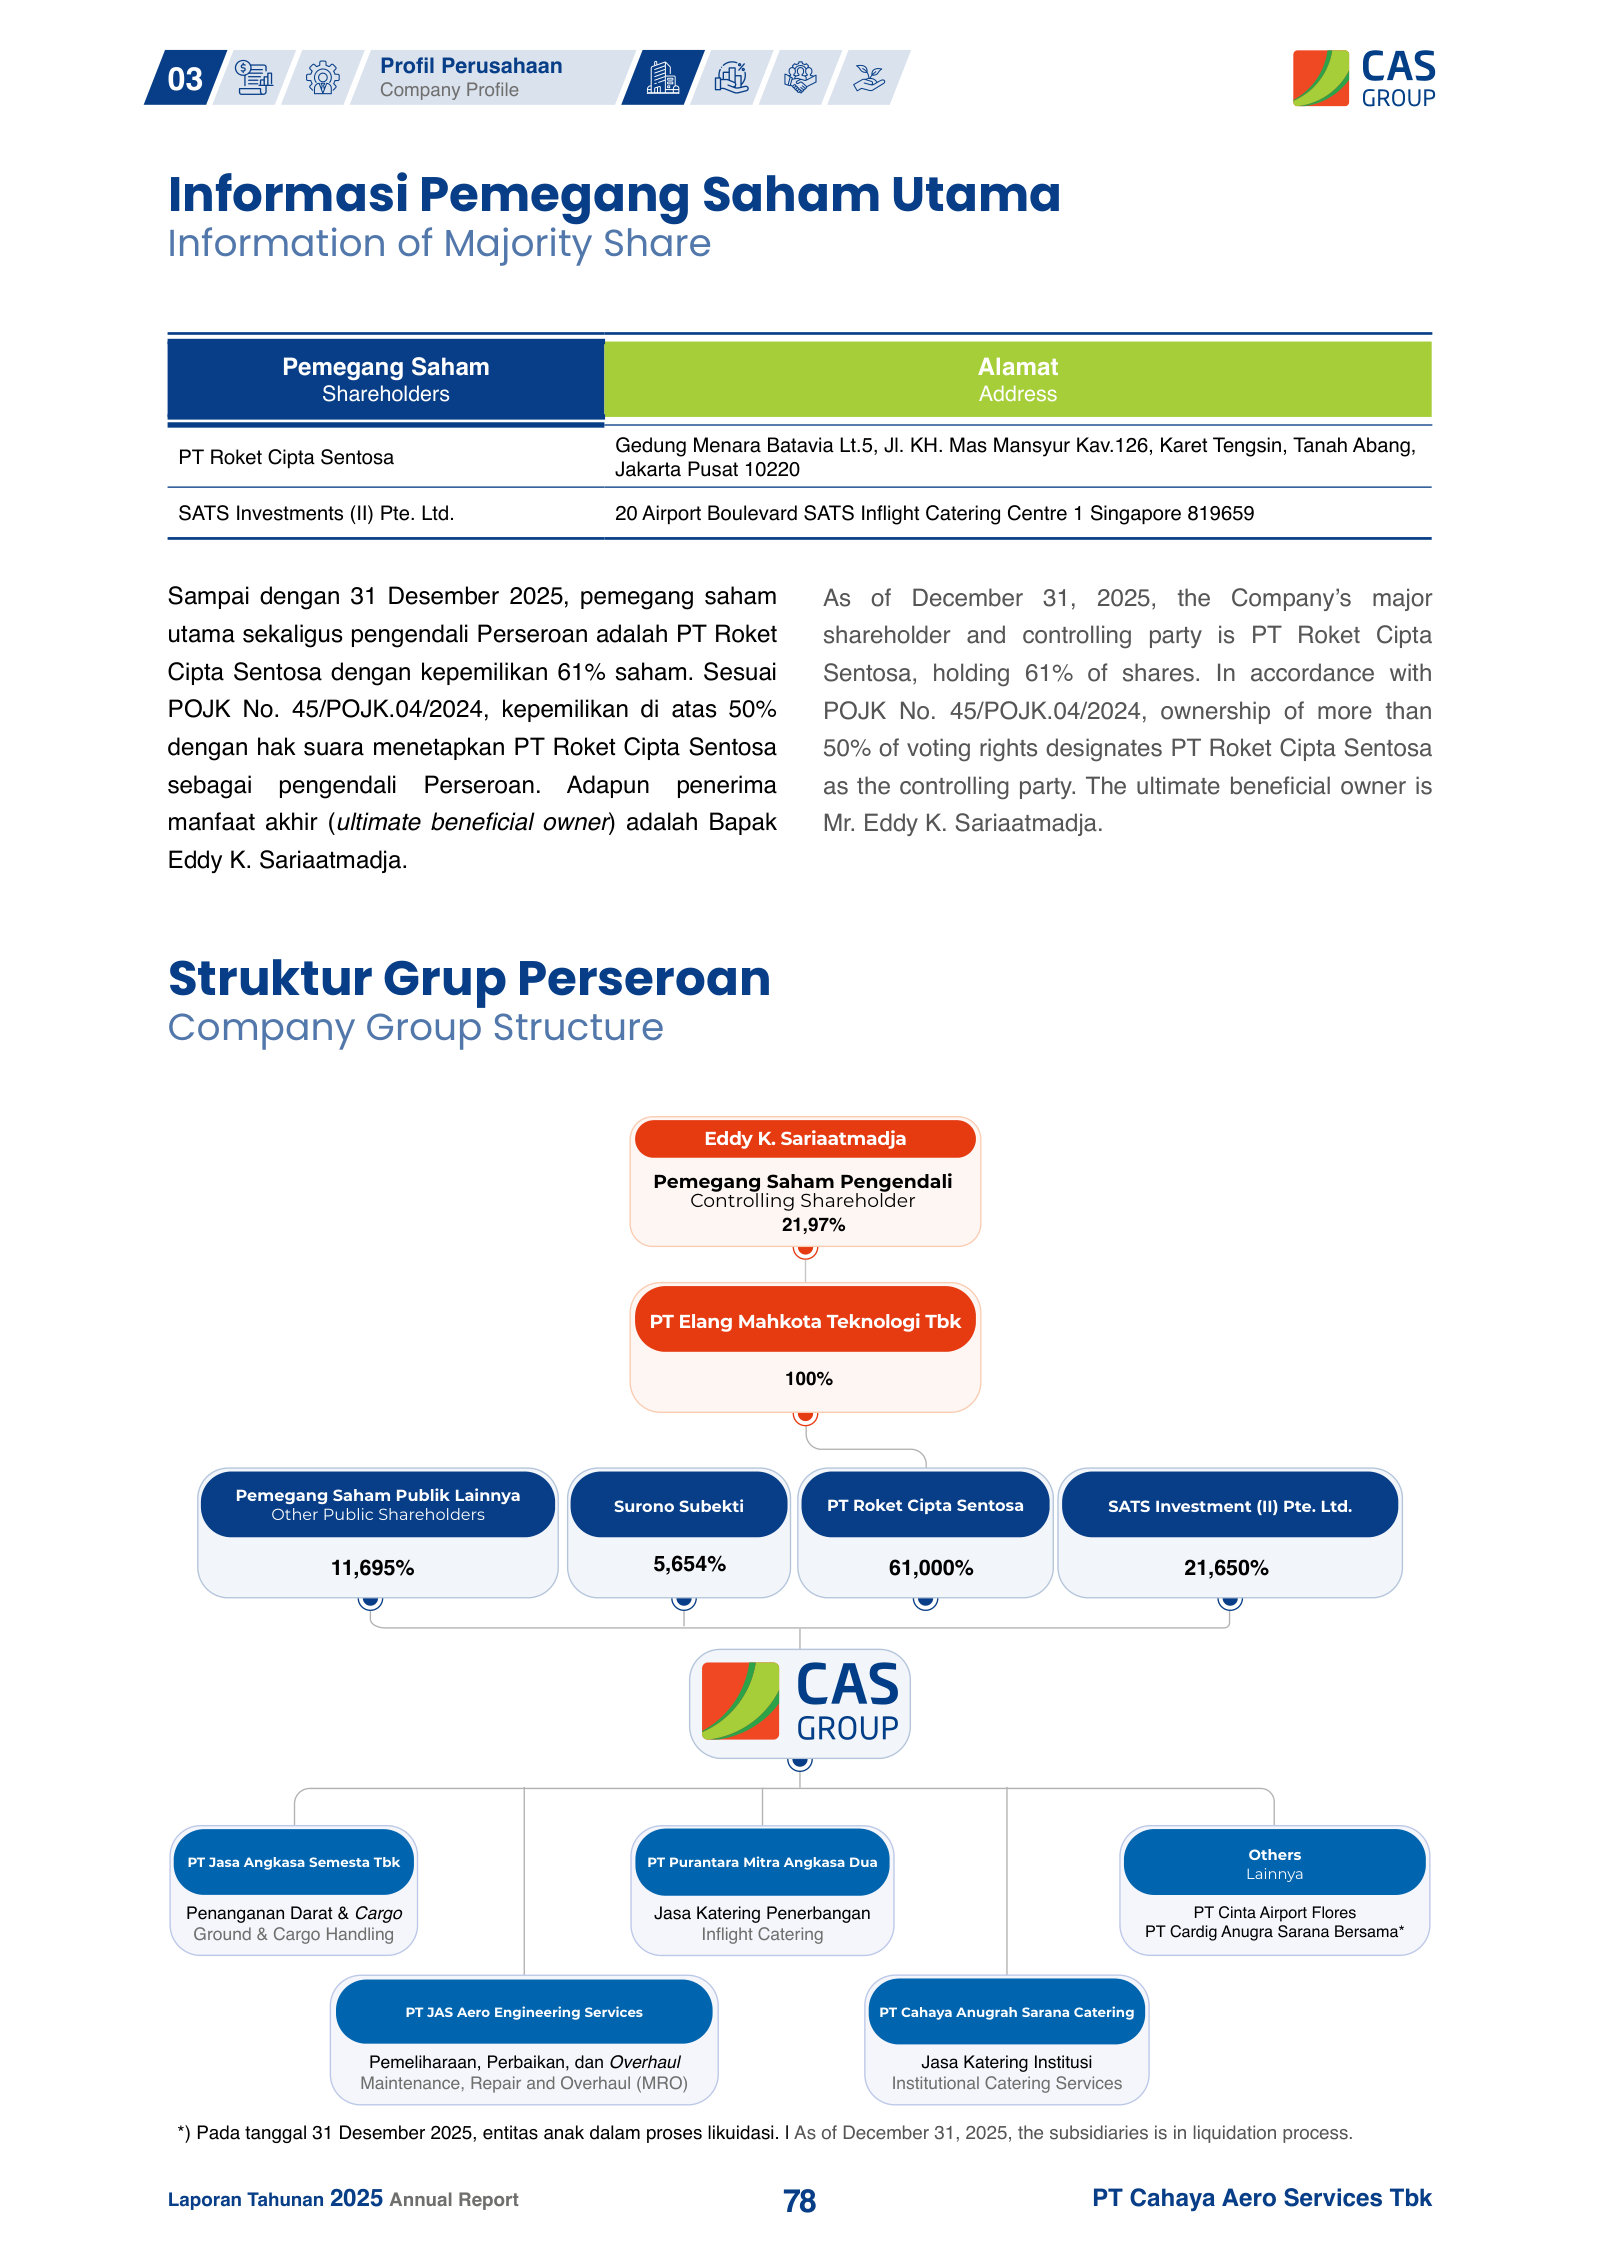
Who controls the company: 61% held by EMTEK's vehicle, ultimate beneficial owner Eddy K. Sariaatmadja.
Controlling shareholder and ultimate beneficial owner as at 31 December 2025.
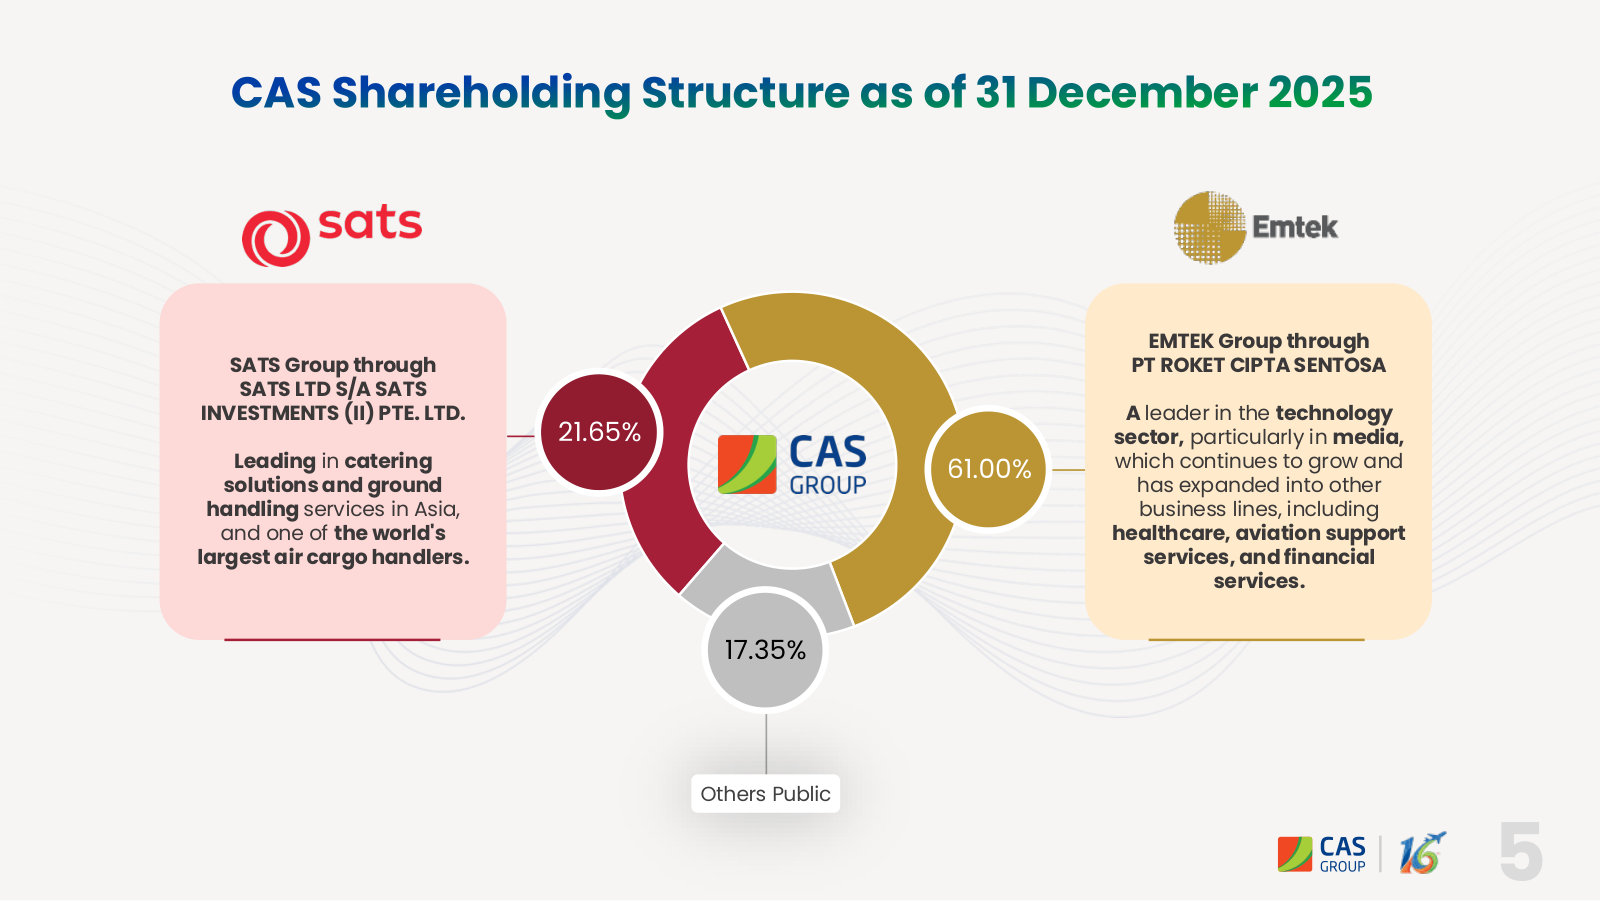
As of December 31, 2025, the Company’s major shareholder and controlling party is PT Roket Cipta Sentosa, holding 61% of shares. In accordance with POJK No. 45/POJK.04/2024, ownership of more than 50% of voting rights designates PT Roket Cipta Sentosa as the controlling party. The ultimate beneficial owner is Mr. Eddy K. Sariaatmadja.
p. 78 · Read in context →
Entitas Anak dan Afiliasi / Subsidiaries and Affiliates — p. 79 · Read the full section →
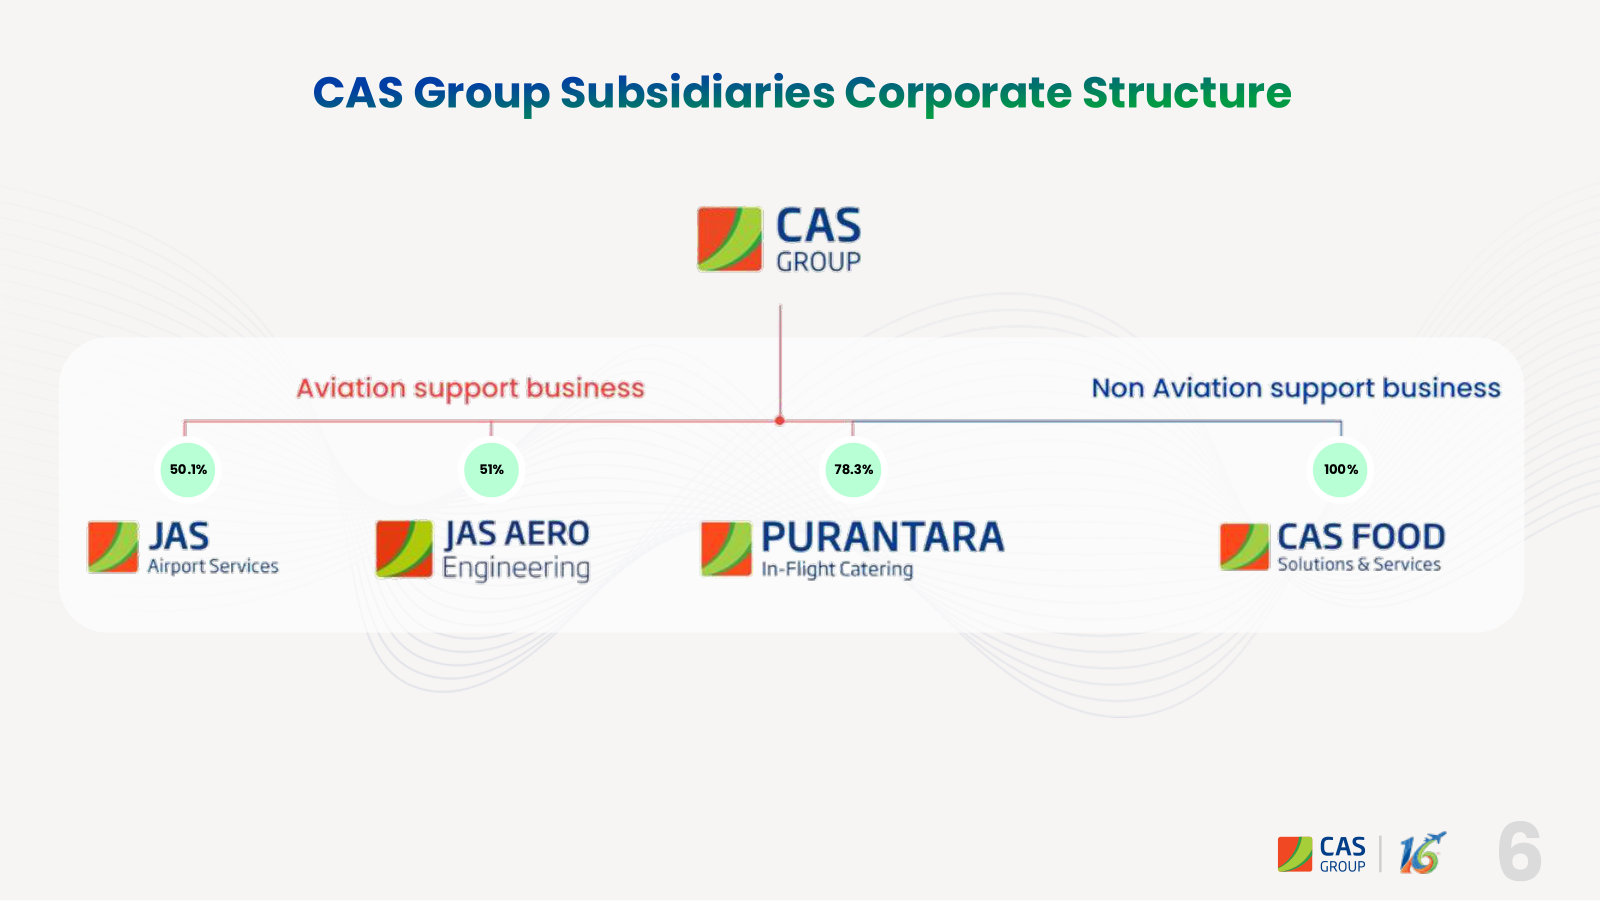
How CASS actually earns: the operating subsidiaries — JAS, JAE, PMAD — with ownership stakes and asset base.
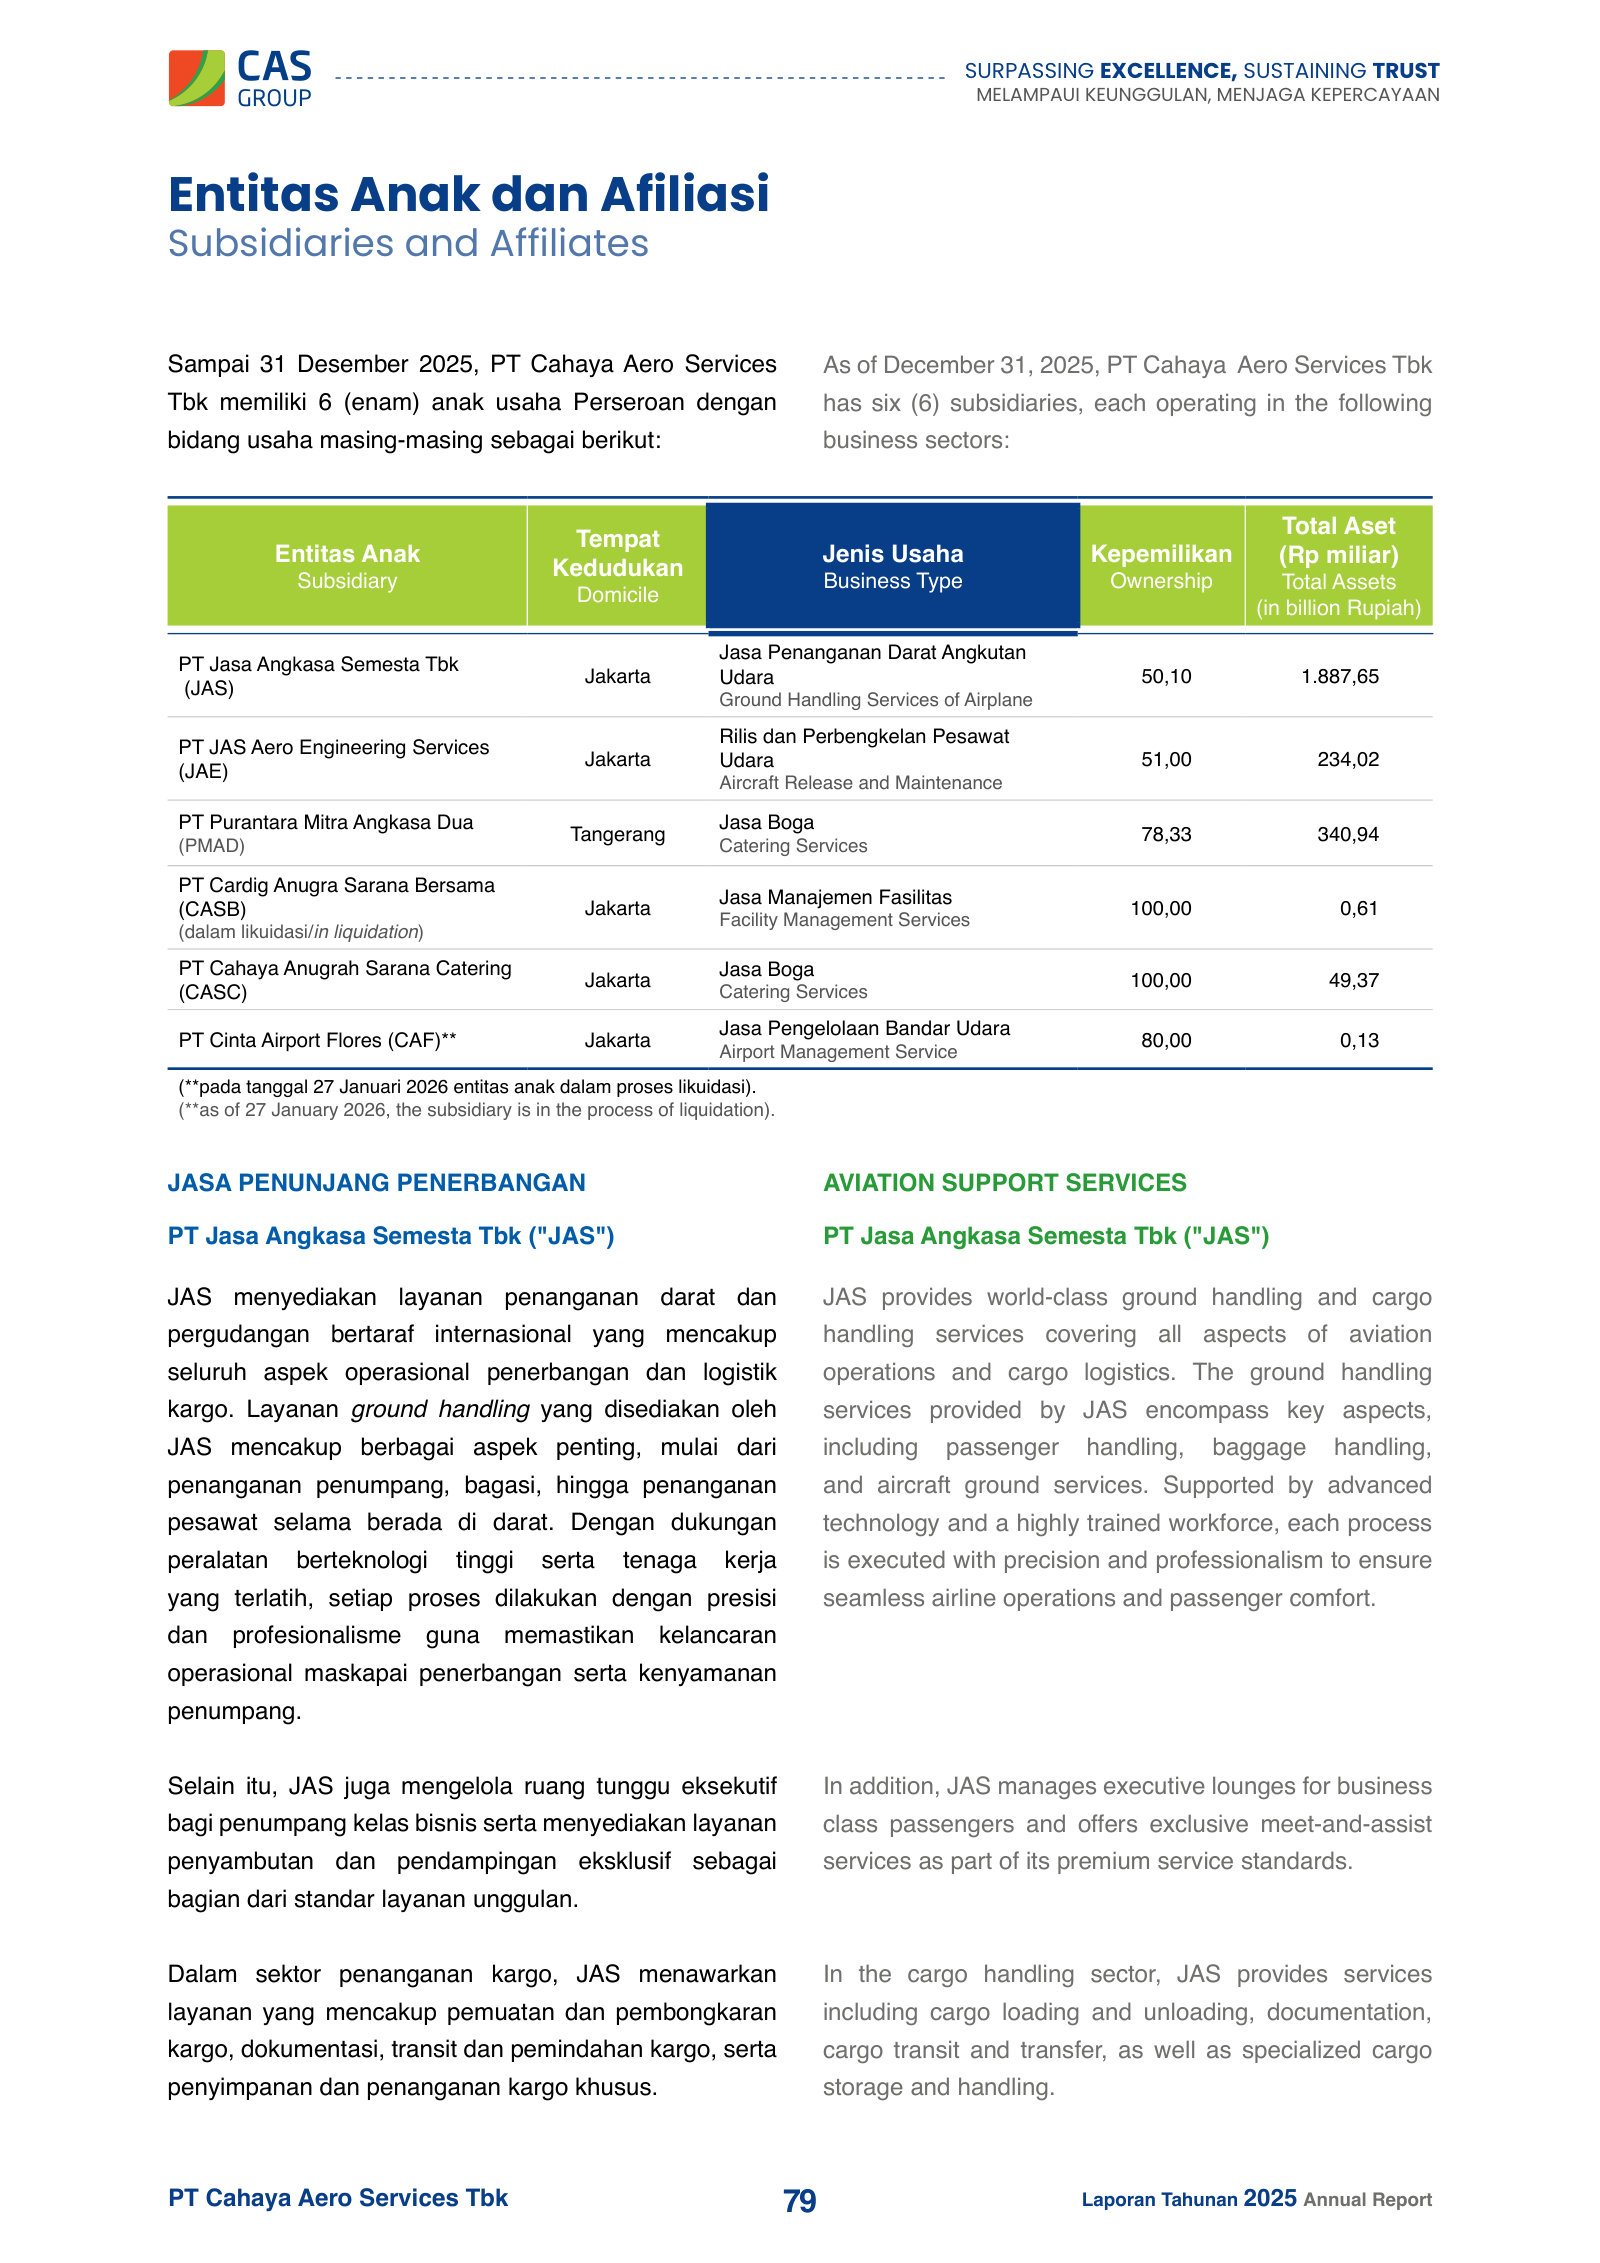
JAE, the aircraft maintenance (MRO) arm, described.
JAE is a Maintenance, Repair, and Overhaul (MRO) company that provides maintenance and technical handling services for both domestic and international aircraft. These services include regular maintenance inspections and in-depth checks to ensure aircraft safety and operational reliability.
p. 80 · Read in context →
Tinjauan Operasional per Segmen / Operational Overview by Segment — p. 102 · Read the full section →
2025's reporting reset — four segments collapsed into Aviation and Non-Aviation — plus the growth behind each.
Management explains the move from four segments to two, effective 2025.
As part of its ongoing efforts to sharpen business focus and enhance transparency for stakeholders, the Company implemented an adjustment to its operational segment structure in 2025. While in the previous period the Company’s performance was reported across four (4) business segments, starting in 2025, the Company consolidated all of its operational activities into two (2) segments, namely Aviation Services and Non-Aviation Services.
p. 102 · Read in context →
Tinjauan Keuangan / Financial Review — p. 108 · Read the full section →
Management's read on the balance sheet: assets +21.6%, equity +38.8%, liabilities down, cash building.
Cash grew from Rp1.5tn to Rp1.8tn, strengthening liquidity.
Overall, this increase in Current Assets reflects a stronger liquidity position for the company, with significant cash growth providing greater financial flexibility to support its operations and business strategy.
p. 110 · Read in context →
Prospek Usaha / Business Prospect — p. 126 · Read the full section →
The risk that could genuinely bite: Middle East airspace closures already cut handled flight volumes 15–20%.
Management warns of a 15–20% volume decline and a real risk of a 2026 loss if the conflict persists.
This global aviation crisis massively pressures the operations of the Company's subsidiaries. Airspace closures forced Middle Eastern airlines to halt nearly all of their operations, including routes to cities in Indonesia. This impacted a 15-20% decline in flight volumes handled by JAS, JAE, and PMAD. Should the geopolitical conditions in the Middle East fail to improve, worsening the aviation fuel crisis, the Company projects that not only to Middle Eastern airlines, other global airlines will also experience operational impacts, causing the flight volumes handled by the Company's subsidiaries to decline even further.
This operational decline is experienced across all of the Company's core business units, including Ground Handling, Cargo Handling, Line Maintenance, and Inflight Catering services. Financially, the Company recorded a revenue decline of up to 30% for each day the closure of Middle Eastern airspace continues.
Considering the uncertain resolution of the conflict, the Company has decided to comprehensively review and postpone its strategic development initiatives and diversification projects until regional stability and market visibility are demonstrably restored.
If geopolitical instability persists and significantly further affects the flight frequencies of non-Middle Eastern airlines, the Company faces a real potential and risk of recording a loss for the 2026 financial year.
p. 127 · Read in context →
More annual reports
PT Cardig Aero Services Tbk — FY2024 Annual Report — FY2024 · 542 pages · The transition year: EMTEK's PT Roket Cipta Sentosa acquired 51% control in April 2024, still under the old four-segment structure. · Open →
PT Cardig Aero Services Tbk — FY2023 Annual Report — FY2023 · 434 pages · Last full year under SATS as majority owner, showing the pre-EMTEK baseline and post-pandemic recovery. · Open →
PT Cardig Aero Services Tbk — FY2022 Annual Report — FY2022 · 340 pages · Early recovery year as aviation traffic returned after COVID-19 restructuring. · Open →
PT Cardig Aero Services Tbk — FY2021 Annual Report — FY2021 · 332 pages · Pandemic-trough report documenting the efficiency and restructuring measures that reshaped the group. · Open →
Competitors describe PT Cahaya Aero Services Tbk (formerly PT Cardig Aero Services Tbk)'s market in their own filings and calls. These verified passages and visual pages show where their strategies meet, using source documents preserved in Sources.
SATS Ltd. (S58)
SATS runs the same three revenue lines as CASS — airport ground handling, air cargo handling and in-flight catering — and is the reference operator for that bundle across Asia-Pacific, bidding for the same carrier mandates CASS's JAS and catering arms serve in Indonesia. The relationship is two-sided: SATS Investments (II) holds 21.65% of CASS per the FY2025 shareholder table, so SATS is at once a large minority holder and the scaled version of the business CASS is trying to be. Only the gateway, ground and food discussion is used here.
How the mandates in this industry actually change hands, in SATS's own telling: two ground-handling wins (Allegiant at Sanford, and hub ground handling for Azul — which SATS calls the largest low-cost carrier in Brazil — at Viracopos) and one multi-year in-flight catering contract with Turkish Airlines, won on halal production out of Narita and Haneda. The wins are airline-by-airline and station-by-station, and management notes the Turkish contract was one it had been chasing for some time. Nothing here is quantified; the point is the unit of competition, which is the same unit CASS competes on in Indonesia — one carrier, at one airport, at a time.
Kerry Mok, President and CEO, prepared remarks: As I mentioned, we also won two new wins. One is Allegiant Air in Sanford Airport, which is the a hub airport in the US, and Azul in Viracopos Airport, which is actually in São Paulo. Azul is actually the largest low-cost carrier in Brazil, and we are actually their hub provider for ground handling in Brazil. So that's a fantastic win for our team in Brazil as well, and we continue to grow our presence in Brazil with some of these wins that we have locked in.
On the food side, very pleasing to say we have won a multi-year in-flight catering contract with Turkish Airlines. Turkish Airlines is leveraging on halal-produced meals out of Narita and Haneda, and it's been a win. It's been a contract we've been aiming for quite some time, and very happy that our team in Japan managed to secure the contract with Turkish Airlines.
p. 2 · Read in context →
SATS's forward view on the two segments that matter to CASS. On ground handling it flags low-cost carriers as the thing to watch — management says quite a lot of flight cancellations are LCC-related because those business models cannot absorb high fuel prices — while arguing that a broad station network lets it recapture the replacement capacity. On food it expects stability, helped by long-haul Asia–Europe flights that carry more catering per departure than short-haul. This is one operator's outlook, not a market forecast, and the rerouting benefit it describes is specific to its own Singapore, Thailand and Gulf stations. Read against CASS, whose handled traffic is weighted to Indonesian LCC and domestic short-haul flying, it identifies the exposure and the offset separately.
Kerry Mok, President and CEO, FY26 outlook, prepared remarks: Ground Services: On the ground side, obviously Asia Pacific is driving that, and a lot of the rerouting is also benefiting Asia. Singapore, Thailand are all airports where a lot of reroutings are going and increasing long-haul flights from Asia to Europe to cover up for the Middle East. Clearly, it's actually helping our ground business as well.
We have very limited exposure. In fact, I said the last time, both in Saudi and Oman are benefiting now from some of the rerouting, and we are well-placed there to continue to serve our customers in those hubs itself.
The one thing that we need to be mindful of are the LCCs. Because of the fuel cost, their business models cannot afford the high fuel prices. And frankly, quite a lot of flight cancelations are all related to LCC flights. And that's having an impact on some of our ground business as well. But with that, it's new services and new capacities are coming up to cover for those cancelled flights.
So, if again, if you have those network, you'll continue to benefit. And we're pleased that the wins in Azul and Allegiant Air will continue to drive our year-on-year non-like-for-like growth. These two new wins are very important for us in Americas and will strengthen our ground handling business this coming year itself.
Food Services: On the food side, we believe it's going to be stable. Partly also because although the flights cancelled to the Middle East still remains, but carriers such as Singapore Airlines and others are adding on more flights from Asia to Europe. And in fact, those are long-haul flights, which has additional catering requirements. So again, we'll drive some of the volumes that we'll see in the coming months ahead.
p. 9 · Read in context →
The margin mechanic in catering, stated plainly by a peer: input costs are rising with energy, contracts hold the old prices until they roll, and only then does the caterer get to reprice — 'as the contracts run out, we will be facing some increase in food costs.' Management also concedes its non-aviation central kitchens in Bangalore and Tianjin are 'still not where we want it to be' while growing. Both points bear on CASS's catering business, which sells under airline contracts on the same lag and is pursuing the same non-aviation expansion; the ramp difficulty is SATS's own characterisation of its own kitchens.
Kerry Mok, President and CEO, prepared remarks: The non-aviation side remains very resilient. Our Bangalore and Tianjin kitchen are now starting to make meaningful progress, albeit still not where we want it to be. But we're showing good growth momentum for Bangalore and Tianjin, and we believe that will still continue as we develop more products for the market itself.
We need to watch out for input costs for food. Clearly, with the increase in energy cost, it will impact our food prices in the near term. And it's something that the commercial team will have to work on with our customers to see how we can mitigate some of the costs. But we do have contracts in place, and as the contracts run out, we will be facing some increase in food costs.
p. 10 · Read in context →
MacroAsia Corporation (MAC)
The closest structural twin to CASS anywhere in ASEAN: a listed holding company whose aviation group is in-flight catering plus ground handling plus aircraft MRO and pilot training, run through joint ventures — including two with SATS — at a single dominant capital-city gateway, with a deliberate push into non-aviation services alongside. Ninoy Aquino is to MacroAsia roughly what Soekarno-Hatta is to CASS. Only the aviation and food discussion is used here; the water, property and mining segments are out of scope.
MacroAsia's description of the two aviation businesses that map onto CASS's JAS and JAE. MASCORP is claimed as the Philippines' largest and most comprehensive ground handler, across twenty-two airport stations nationwide — against the JAS network's stated presence at 17 major Indonesian airports. The second fragment is the MRO arm, Lufthansa Technik Philippines, which the report places in direct competition with the Singapore and Hong Kong shops and sells on proximity: a four-hour flight radius to the major Asian hubs. 'Largest' and 'industry-leading' are the company's own claims; the station count is a countable fact. The MRO framing is the more useful one — it shows heavy maintenance being competed for regionally rather than nationally, which is the market CASS's line-maintenance arm sits at the edge of.
Established on September 12, 1997, MASCORP is the country’s largest and most comprehensive ground handling service provider. The company delivers a full suite of airport services, including:
MASCORP supports both domestic and international airline clients across twenty-two (22) airport stations nationwide. Competing in a dynamic aviation market, the company consistently upholds industry-leading standards of safety, eficiency, and customer service. […] Competing with leading regional MRO providers in Singapore and Hong Kong, LTP leverages the strength of the Lufthansa network and the expertise of its highly skilled Filipino workforce. The company specializes in base maintenance checks for major aircraft types, including Airbus A320 family, A330, A340, A380, and Boeing 777, as well as major modifications, cabin reconfiguration and retrofit programs, and lease return checks. Its scalable docking systems accommodate multiple aircraft types, and its facilities can simultaneously service three (3) A380s.
Strategically located within a free trade zone at NAIA, the country’s main international gateway, LTP also operates maintenance stations in Cebu, Clark, Davao, Kalibo, and Puerto Princesa. Its Philippine base ofers proximity to major Asian hubs such as Hong Kong and Singapore—both within a four-hour flight radius.
p. 11 · Read in context →
A peer putting numbers on both of CASS's core lines in one passage. Meals rose from 23.30 million to 26.92 million and drove an 11% segment revenue gain, with foreign-airline catering up 11% and Philippine Airlines catering up 12% 'despite limited capacity headroom'; flights handled grew 4% for only a 3% revenue gain, 'even as overall flight activity at the country's main gateway slightly declined.' The last clause is the notable one: MacroAsia grew handled volume while its home airport's total traffic fell, which is a share statement rather than a market one. It also names Air Canada and Air India as 2025 wins at NAIA. The 'preferred airline services provider' label is MacroAsia's own.
Eduardo Luis T. Luy, President and COO, shareholder letter: We continue to strengthen our core aviation business units, as reflected in improved performance across key metrics. Meal volumes increased from 23.30 million in 2024 to 26.92 million in 2025, driving an 11% rise in top-line revenues for the segment. Our airline-focused companies delivered solid results, with foreign airline catering and Philippine Airlines catering recording revenue growth of 11% and 12%, respectively, despite limited capacity headroom.
Meanwhile, flights handled grew by 4% year-on-year, translating to a 3% increase in revenues, even as overall flight activity at the country’s main gateway slightly declined.
In 2025, NAIA welcomed new direct flights from Air Canada and Air India. Both prestigious airlines chose to avail of MacroAsia’s services, further strengthening our reputation as the preferred airline services provider in the Philippines. As the airport continues to enhance activity and operational eficiency, our Group remains committed to keeping pace with these developments by expanding our client portfolio and leveraging decades of experience and high service standards to deliver quality inflight oferings for international passengers.
p. 5 · Read in context →
Saigon Ground Services Joint Stock Company (SAGS) (SGN)
A listed, non-airline-owned ground handler at Tan Son Nhat and Da Nang running the same service stack as JAS — passenger, ramp, baggage, load control and cargo — for an overlapping carrier base, in a Southeast Asian market with the same structure as Indonesia's: a flag-carrier-affiliated incumbent handler plus airlines that increasingly handle themselves. Its annual report is unusually direct about who it loses to and why.
SAGS's own 'Industry Competition Risks' disclosure, taken from the English column of the bilingual report. It names two distinct threats. The first is VIAGS, the Vietnam Airlines-owned handler, which competes head-on at Tan Son Nhat and Da Nang and holds a stake in the rival handler at Cam Ranh — the structural analogue of Gapura Angkasa against JAS in Indonesia. The second is airlines doing the work themselves: SAGS records that Pacific Airlines now self-handles at Tan Son Nhat and serves Bamboo Airways, 'a former client of the company,' and that Vietjet handles at both Noi Bai and Tan Son Nhat. That is a named account moving from a third-party handler to a carrier-owned one, disclosed by the handler that lost it.
Vietnam Airport Ground Services Company Limited (VIAGS), which provides airport ground services at three major airports—Tan Sơn Nhat, Da Nang, and Hanoi—directly competes with Saigon Ground Services Joint Stock Company at Tan Sơn Nhat International Airport and Da Nang International Airport. Additionally, VIAGS has a stake in Aviation Ground Services Limited Liability Company (AGS) at Cam Ranh International Airport, a direct competitor of SAGS – Cam Ranh in Khanh Hoa. […] Pacific Airlines has been providing ground handling services at Tan Sơn Nhat International Airport and currently serves Bamboo Airways, a former client of the company. […] Vietjet Air has been providing ground handling services at Noi Bai International Airport and Tan Sơn Nhat International Airport.
p. 14 · Read in context →
The other side of the same ledger: SAGS's 2025 contract wins, dated carrier by carrier — United Airlines at Tan Son Nhat, and at Da Nang Air Premia, Emirates, Scoot, Parata Air and Greater Bay Airlines, plus domestic start-up Sun PhuQuoc Airways. Several of these carriers also fly to Indonesian stations CASS handles. Read with the exhibit above, it shows the churn profile of an independent handler: a steady stream of new international carriers arriving while incumbent domestic volume is exposed to self-handling.
In 2025, international airline operations recorded positive growth in frequency compared to 2024. The Company successfully secured agreements with and welcomed several new international airline partners, including United Airlines (UA) at SGN commencing from 26 October 2025; and at Da Nang (DAD): Air Premia (YP) from 23 January 2025, Emirates (EK) from 02 June 2025, Scoot (TR) from 20 October 2025, Parata Air (WE) from 24 November 2025, and Greater Bay Airlines (HB) from 24 December 2025. In addition, the Company continued to expand its domestic customer base by securing a ground handling agreement with Sun PhuQuoc Airways (9G), commencing operations from 01 November 2025.
p. 16 · Read in context →
What the win list above added up to. SAGS handled 69,726 flights in 2025 (27,400 domestic, 42,326 international), beat its own revenue plan by 11% and its profit plan by 31% — and still printed revenue down 1% and net profit down 23% against 2024. Note the figures use Vietnamese decimal punctuation in the volume line and English punctuation in the money lines; both are as published. The gap between plan and prior year is the useful part: at a comparable Southeast Asian gateway handler, six new international carriers did not offset the mix and pricing that were lost, and margin fell faster than revenue.
Total number of flights handled by the company in 2025: 69.726 flights, with 27.400 Domestic flights and 42.326 International flights. […] In 2025, the consolidated revenue of SAGS reached VND 1,545 billion, exceeding the 2025 target by 11% (planned revenue: VND 1,392 billion) and marking a 1% decrease compared to 2024 (revenue in 2024: VND 1,565 billion). […] In 2025, consolidated profit reached VND 208 billion, representing a 31% increase over the planned target (VND 159 billion), while declining by 23% year-on-year compared to 2024 (VND 271 billion).
p. 15 · Read in context →
Noi Bai Catering Services Joint Stock Company (NCS)
An airport in-flight catering pure play at Hanoi's Noi Bai, serving many of the same foreign carriers CASS caters for, and running the same two-sided strategy as CAS Food: hold the airline meal contracts, then push the same kitchens into non-aviation food. Because it is a pure play, its annual report says out loud what is buried inside larger groups — how airline catering is repriced, and how badly airport kitchen economics travel into the retail market.
NCS's own account of where an airport caterer's pricing power sits, from the disadvantages and solutions sections of its 2025 management report. Airlines 'tend to tighten budgets and strengthen quality management, making negotiations more difficult'; low-cost carriers pull volume off the short- and medium-haul routes that traditional Asian carriers cater. On the non-aviation side the admission is blunter: because inputs must meet aviation food-safety procedure, 'the product costs are relatively high, making them not competitive enough to be distributed through supermarket channels.' Its answer is longer-tenor re-signed airline contracts with updated prices, and institutional channels — school meals — rather than retail. That is the same wager CAS Food is making with industrial catering, described by a peer that has already hit the ceiling in retail.
Airlines tend to tighten budgets and strengthen quality management, making negotiations more difficult. […] Intense competition from low-cost carriers significantly affects passengers of other traditional Asian airlines, especially on short- and medium-haul routes. […] NonAir products continue to face strong competition from the external F&B market. Although the company's products are highly appreciated by consumers, because the input materials must be controlled according to strict procedures to ensure food safety and hygiene, the product costs are relatively high, making them not competitive enough to be distributed through supermarket channels; […] For the field of providing meals to airlines: The company successfully negotiated and re-signed contracts with longer terms; adjusted service standards and updated appropriate selling prices; […] Continuing to provide meals to the school system is one of the factors driving non-air revenue growth;
p. 7 · Read in context →
How a rival caterer sizes its own demand. NCS attributes 2025 international growth to route expansion and to a specific policy lever — Vietnam's 45-day visa exemption and 90-day e-visas extended to nearly 100 countries — with the strongest volumes on Korea, China and Middle East routes. It then makes the capacity argument for going non-aviation: the plants, cold storage and production lines built for airline meals can be turned to packaged food and beverages. These are management's attributions rather than measured elasticities, but the pairing is the point — inbound-visa policy drives the airline meal count, and spare kitchen capacity is what funds the move off-airport. Both levers are live for CASS in Indonesia.
In 2025, the market continues to record stable growth in the domestic segment, maintaining its role as an important foundation for total output. At the same time, the international market recovers and grows positively thanks to the expansion of flight networks and favorable visa policies of Vietnam. The 45-day visa exemption and the issuance of e-visas for up to 90 days to nearly 100 countries have created significant momentum, boosting the number of inbound visitors considerably; […] In addition, many new international flight routes have been put into operation, especially in key markets such as China. The operating volume recorded good growth on routes to and from South Korea, China, and the Middle East, contributing to strengthening the overall growth momentum of the market in 2025; […] Processing plants, cold storage, modern production lines serving aviation can be leveraged to produce packaged food and beverages for the Nonair sector.
p. 6 · Read in context →
The prior-year version of the same disclosure, useful as a check on whether the constraint is cyclical or structural. In 2024 NCS gave the same two reasons its off-airport food cannot compete — distance from the city centre and strict production standards feeding straight into price — and disclosed that meal production volume ran 7% below plan while it cut utility costs 10% below plan. Two years running, the peer describes the airport kitchen's cost base as the binding constraint on non-aviation expansion, not demand.
The fiercely competitive F&B market requires NCS to continuously research and develop new products and create new experiences to attract customers. The geographical location far from the city centre and strict production standards are among the factors that directly affect product prices and affect NCS's competitive advantage; […] In 2024, the company implements electricity and water-saving policies. The electricity and water costs for 2024 are reduced by 10% compared to the 2024 plan, while the total meal production volume is reduced by 7% according to the 2024 plan.
p. 7 · Read in context →
More peer documents
SGN_annual_report_FY2024 — 74 pages · Pages 12 and 27: the FY2024 competition disclosure (naming Bamboo Airways' departure a year earlier) and the Long Thanh International Airport tender, where SAGS won ground-services lot No. 2 in consortium with Hanoi Ground Services — a greenfield-hub concession contest with no Indonesian equivalent yet. · Open →
What CASS Is, and Who Owns Its Profit
PT Cahaya Aero Services (CASS) is the largest independent ground-handling and airport-services group in Indonesia, riding a full post-COVID recovery: revenue reached Rp3,255,520 million in FY2025, up from a Rp1,222,921 million trough in 2020, at a 29.5% operating margin and on a net-cash balance sheet [1]. The complication a new investor must grasp first: the company only half-owns the business that drives it, so 45.5% of group profit belongs to someone else [2].
The company at a glance
CASS traces to PT Jasa Angkasa Semesta (JAS), founded in 1984 to handle aircraft on the ground at Jakarta's Soekarno-Hatta airport. Today the group runs four operating subsidiaries across airports throughout Indonesia — ground and cargo handling (JAS), aircraft line-maintenance and release certification (JAE), and in-flight and industrial catering (PMAD and CASC) — serving carriers including Singapore Airlines, Scoot, LOT Polish Airlines and Royal Brunei [3]. It is an almost pure aviation-services play: the Aviation division generated Rp3,206,567 million of FY2025 revenue against Rp168,571 million from Non-Aviation [4].
FY2025 Revenue (Rp m)
Operating Margin
Profit to CASS Owners (Rp m)
Net Cash (Rp m)
Trailing P/E (x)
Profit Owned by Minorities
Sources: Q4 FY2025 statements of profit or loss and financial position [5] [6]; net cash and P/E derived from reported figures and the Rp1,890 close of 30 July 2026.
At the group level the numbers look excellent. Revenue has compounded at roughly 22% a year since 2020, operating margin has climbed from 24.9% in FY2023 to 29.5% in FY2025, and the balance sheet carries Rp1,774,110 million of cash against only Rp94,152 million of lease debt — net cash of about Rp1,680,000 million [7]. Operating cash flow of Rp904,392 million against capex of only Rp102,855 million makes this a genuinely cash-generative, asset-light franchise [8].
The recovery — and the wedge inside it
Group revenue has more than doubled off the pandemic floor. But the more revealing view splits the bottom line between the two claimants on it: the owners of the CASS parent, and the non-controlling interests (NCI) in its part-owned subsidiaries.
Source: Q4 FY2025 statement of profit or loss and prior-year comparatives; minorities derived as profit for the year less profit attributable to owners of the parent [9].
The pattern is structural, not new. In FY2020, when the group posted a loss, minorities still earned a positive Rp27,722 million while CASS's own owners absorbed an Rp88,147 million loss — because the losses sat in the wholly-owned units, and the profitable ground-handling business was only half the parent's to lose.
CASS consolidates 100% of a ground-handling business (JAS) it owns just 50.10%, so 45.5% of FY2025 group profit — Rp382,293 million of Rp839,517 million — accrued to non-controlling interests, and in FY2025 those Singapore partners drew Rp256,018 million of cash dividends out of the subsidiaries plus a Rp17,529 million SATS management fee while CASS's own public shareholders received Rp0 for a fourth straight year. [10] [11] [12].
The crown jewel is half-owned
The engine is PT Jasa Angkasa Semesta. On a standalone basis, JAS generated Rp2,547,681 million of revenue and Rp651,164 million of net profit in FY2025 — roughly 78% of group profit from about 58% of group assets — yet CASS holds only 50.10% of it [13]. The other 49.8% sits with SATS Ltd of Singapore, acquired in 2004 [14]. The auditors flag JAS explicitly as the only NCI "considered material" to the group [15].
The same JV logic runs through the portfolio: SATS partners CASS across the value chain.
Source: Q4 FY2025 Note 1c, list of subsidiaries and percentage of ownership [16]; partner identities from the company's brief history and milestones [17].
Book equity tells the same story from a different angle: of Rp2,251,293 million of total equity, Rp711,804 million belongs to minorities and Rp1,539,489 million to CASS owners [18]. Minorities hold 31.6% of the book but earn 45.5% of the profit — a reminder that headline group returns overstate what the CASS share actually earns. The frequently quoted 20.3% group "ROE" is itself an artefact of this: it divides parent-only profit by total equity. On a like-for-like basis, CASS owners earned closer to 29.7% on their Rp1,539,489 million of equity — a strong return, but on a smaller base than the consolidated accounts imply.
Control changed hands; cash does not reach the float
In April 2024, PT Roket Cipta Sentosa — a subsidiary of Indonesian media-and-technology group EMTEK (PT Elang Mahkota Teknologi) — acquired 51% of CASS, and lifted that to 61% in April 2025 by buying a further tranche from SATS [19]. SATS remains a 21.65% holder of the parent even after selling control, so the public free float is roughly 12% [20].
Source: Q4 FY2025 Note 19, composition of shareholders [21].
Cash flow through the structure is where minority ownership becomes a question rather than a footnote. In FY2025 the subsidiaries paid Rp256,018 million of cash dividends to their non-controlling holders — chiefly SATS drawing its share out of JAS — while the CASS parent paid no dividend to its own shareholders in either FY2024 or FY2025 [22]. Parent-level retained earnings rose from Rp990,538 million to Rp1,441,290 million over the year, and cash has climbed from Rp453,153 million at end-2023 to Rp1,774,110 million [23]. So while the JV partner pulls cash out at the operating level, the public shareholder's return to date has been entirely a book entry — and the growing cash pile is now controlled by EMTEK.
The market has noticed the change without repricing the franchise. The shares trade at Rp1,890 (30 July 2026), down about 20% from Rp2,350 at the end of January 2026, for a market capitalisation near Rp3.9 trillion and a trailing P/E of roughly 8.6x on parent earnings. No sell-side analyst currently publishes an estimate or price target on CASS, so there is no published consensus to anchor to.
Source: exchange price data, as reported; analyst-coverage status per third-party aggregators, as reported.
What this report examines
CASS is a high-quality, fast-growing, cash-rich aviation-services operator whose reported strength is real but only partly the public shareholder's. How much of CASS's post-COVID growth and cash generation actually reaches its public minority is most sensitive to whether the EMTEK-controlled parent ever distributes: the crown-jewel ground-handling business is only half-owned by a Singaporean partner that draws its share out in cash, and control of a cash-rich, non-dividend-paying parent now sits with EMTEK on a roughly 12% free float. Everything that follows — the durability of the ground-handling economics, what EMTEK intends to do with the balance sheet, the terms of the SATS relationship, and what the low multiple already reflects — bears on whether that parent ever distributes.
Ground Handling Moat
One division does almost all of the earning. CASS's aviation businesses — ground and cargo handling, line maintenance and inflight catering, led by the 50.1%-owned JAS — produced Rp940.7 billion of the group's Rp959.2 billion of FY2025 operating profit, at a 29.3% margin that now sits above pre-COVID levels [1]. The demand side of that franchise looks durable; the airport-access side is renewed every one to three years. This chapter tests how much of the crown jewel is a moat and how much is a lease.
The scale of the franchise
JAS is the operating heart of the group. In FY2025 it handled 80,198 flights, 320,531 tons of cargo and 27.5 million passengers across its Indonesian stations — each line up year on year as domestic and international traffic kept recovering [2].
Flights Handled (FY2025)
▲ 5.1% YoY
Cargo Handled (tons)
▲ 9.9% YoY
Passengers Handled
▲ 5.2% YoY
Source: Aviation segment operational capacity — ground handling, cargo and passenger volumes, FY2025 [3].
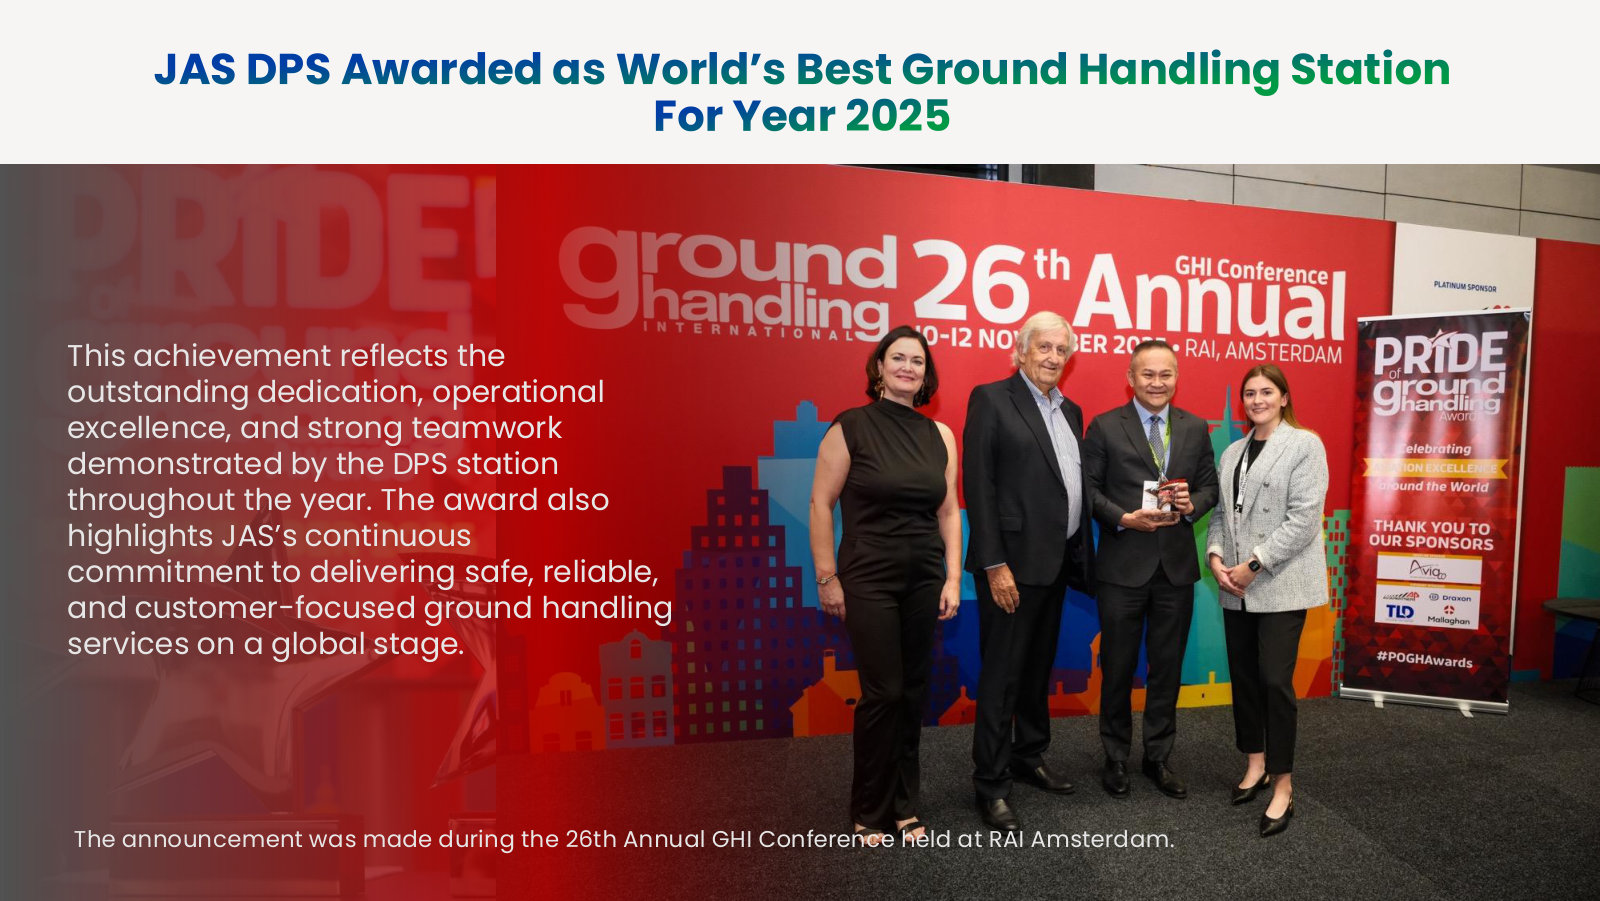
The franchise's edge is operational rather than administrative. JAS traces to 1984 as an early independent handler at Soekarno-Hatta [4], and its line-maintenance affiliate JAE now holds approvals from 18 aviation authorities and releases wide-bodies up to the A380 [5]. Its Denpasar station won Best Station at the 2025 Pride of Ground Handling Awards, judged against a global shortlist — external validation that the operational quality is real, not merely asserted [6].
The profit is concentrated in one division
From FY2025 the group reports on just two divisions — Aviation and Non-Aviation — having previously broken out ground handling, maintenance, catering and facilities separately. On the new basis, Aviation carried 98.5% of revenue and 98.1% of operating profit; the Non-Aviation remainder (institutional catering, facilities) is a rounding item on the earnings line.
Source: FY2025 Consolidated Financial Statements, Note 32 Segment Information (FY2024 comparatives restated onto the two-division basis) [7].
The case is most sensitive to whether the Aviation margin of 29.3% holds: with operating costs largely fixed, a few points of compression flows almost entirely through to profit, so that margin matters more to the earnings than volume growth does. It has held up under scrutiny in one important way: it is not a cyclical rebound overshooting a lower normal. Group operating margin has climbed from 2.4% in the COVID trough of FY2020 to 29.5% in FY2025 — and the FY2025 figure is materially above the 19.8% the group earned in FY2019, the last full pre-pandemic year.
Source: derived from reported operating results; FY2025 audited statements [8] and FY2021 Annual Report highlights [9].
Margins above the pre-COVID line suggest the recovery has been accompanied by genuine operating leverage and cost discipline, not just a volume bounce. That is the strongest single argument that the ~29% is defensible rather than a peak waiting to unwind.
The FY2025 move to two reporting divisions removes the segment-level view of ground handling versus catering versus maintenance that earlier filings gave. Aviation now bundles JAS, JAE and the PMAD catering business together, so the durability of ground handling specifically can no longer be read directly off the segment note.
The durable side: a deep, sticky airline book
What a handler sells is trust with a carrier's aircraft, passengers and cargo, under contracts that are slow to move once won. JAS's ground-handling revenue rests on a roster of roughly 28 named airlines — Singapore Airlines, Cathay Pacific, Emirates, Qatar Airways, Etihad, All Nippon Airways, Turkish Airlines, Qantas, Saudia and a long tail of others — each billed at rates set in bilateral agreements [10].
Two features make that book an asset rather than just a customer list. It is diversified — no single carrier dominates the named list — and it is anchored in the two gateways, Soekarno-Hatta and Bali, where a foreign flag carrier needs an established handler with the ramp equipment, trained crews and safety record to touch a wide-body. Switching handlers mid-network is disruptive and rarely done for a few basis points of price, which is why incumbents at major hubs tend to keep their carriers for years. The blue-chip composition of the list — the world's most demanding long-haul airlines — is itself a quality signal.
The conditional side: the access is a short lease
The moat has a floor it does not own. JAS does not control the airports it works in; it operates under business concession agreements with PT Angkasa Pura Indonesia, the state airport operator. Those agreements — including their extensions — run just one to three years, with the current set expiring by 2028 [11]. The right to be on the ramp at Soekarno-Hatta and Bali — the foundation of the whole franchise — is re-let on a rolling basis by a landlord that CASS does not influence.
That landlord is not neutral. Angkasa Pura now sits inside InJourney, the state aviation holding group, which also controls Gapura Angkasa (rebranded InJourney Aviation Services) — JAS's principal domestic ground-handling rival — and Aerofood ACS, the main competitor to CASS's catering arm [12]. In other words, the counterparty renewing JAS's airport access every one to three years is affiliated with the competitor that would gain most if JAS lost it.
The access is also toll-heavy. On the cargo side, JAS operates the international cargo terminals as a revenue-share with Angkasa Pura: cargo-sharing cost ran to Rp434.1 billion in FY2025, up from Rp410.0 billion, or about 13% of group revenue routed straight to the airport operator [13]. The 29% margin is what survives after that toll — but the toll is set by the same counterparty that controls renewal, and it has been rising.
The durable and fragile sides sit together: a blue-chip airline book that is hard to dislodge, standing on airport concessions that are short-dated and controlled by a state group aligned with the competition. A handler's contracts with carriers mean little without the concession to be at the airport at all.
A live cyclical test, and what would change the read
The near-term reminder that this is still a traffic-geared business arrived in the FY2025 report itself. Management flagged that escalating Middle East conflict — the closure of the Strait of Hormuz and disruption of regional airspace — had triggered the group's largest weekly reduction in flight capacity since COVID, and said it would re-assess its 8% FY2026 growth target until visibility returned [14]. Ground-handling economics are volume-driven and largely fixed-cost; a sustained traffic shock compresses the very margin this chapter has been defending.
The read here: the crown jewel earns its keep, and the demand-side moat — incumbency, a blue-chip book, margins above pre-COVID — is genuine and better than a first glance at "airport services" would suggest. The counter-fact that keeps it from being a fortress is structural, not cyclical: the whole thing is leased from a state landlord aligned with the competitor, on one-to-three-year terms expiring by 2028. What would change the read in either direction is concrete and observable — a multi-year concession renewal (or loss) at Soekarno-Hatta or Bali when the current agreements lapse. That renewal, more than passenger growth, is the event to watch for the durability of the earnings the rest of this report depends on.
The SATS Partnership
CASS consolidates 100% of a ground-handling business (JAS) it owns just 50.10%, so 45.5% of FY2025 group profit — Rp382,293 million of Rp839,517 million — accrued to non-controlling interests, and in FY2025 those Singapore partners drew Rp256,018 million of cash dividends out of the subsidiaries plus a Rp17,529 million SATS management fee while CASS's own public shareholders received Rp0 for a fourth straight year [1].
The withheld dividend is a policy choice, not a capacity limit. Across FY2022–FY2025 the subsidiaries paid roughly Rp635,317 million of cash dividends to their minority partners — Rp113,000 million, then Rp148,887 million [2], then Rp117,412 million and Rp256,018 million [3] — while the public shareholders of the listed parent received Rp0 in every one of those years. The parent itself closed FY2025 with Rp891,591 million of distributable retained earnings and effectively no debt [4], so what the public holder has not received reflects how the controller allocates cash, not an inability to pay it.
The fair counter sits in the same frame: SATS earns its draw. JAS's roughly 29% operating margin partly reflects running inside SATS's global gateway network, and the SATS management fee is priced at about 0.76% of consolidated liabilities and disclosed as an arm's-length related-party transaction (Ground Handling Moat) — the partner's presence is part of why the asset throws off the cash in the first place. What would change the read is a maiden dividend from the parent, which would give the public holder the cash access SATS already has.
Two owners, paid two different ways
Every chapter of this report has circled the same structural fact: CASS consolidates 100% of businesses it only half-owns. This chapter names the other owner and follows its cash. At the operating level, SATS Ltd. — the Singapore-listed ground-handling and gateway-services group — holds 49.8% of the crown-jewel handler PT Jasa Angkasa Semesta (JAS) [5], while CASS holds 50.10% [6]. A sister company in the same Singapore Airlines lineage, SIA Engineering (SIAEC), holds 49% of the aircraft-maintenance arm JAE, where CASS holds 51%; SATS's catering affiliate holds the balancing 21.67% of the catering business PMAD [7].
The point of ownership is cash, and here the two owners are not paid the same way. A subsidiary co-owner is paid in cash at the subsidiary, pro-rata, whenever the subsidiary declares a dividend. A public shareholder in the listed parent is paid only when the parent declares a dividend — which, as the capital-allocation record shows (Capital Allocation), it has not done in four years. The subsidiary co-owner is thus paid in cash as the operating business earns it, while the parent's public shareholder waits on a distribution decision that has not come.
The cash the partner actually draws
In FY2025 JAS paid a total cash dividend of Rp459,978 million, up from Rp194,924 million in FY2024 [8]. Split by ownership, roughly Rp230 billion went up to the CASS parent and roughly Rp229.5 billion — SATS's 49.9% non-controlling share — went to SATS. JAE paid Rp54,059 million, explicitly "to the Company and SIA Engineering Company" [9], of which SIAEC's 49% is Rp26.5 billion.
Those two flows reconcile exactly to the single number the group reports as cash paid to non-controlling interests. The FY2025 statement of changes in equity records Rp256,018 million of cash dividends to NCI [3], and Rp229.5bn (JAS) plus Rp26.5bn (JAE) equals Rp256.0bn. Almost every rupiah of NCI cash that left CASS's subsidiaries in FY2025 went to the two Singapore partners.
Sources: JAS and JAE dividends and management fee, FY2025 audited statements Notes 1c and 27 [10] [11] [12]; parent dividend income, parent-entity cash flow Note 36 [13]. Splits are computed at stated ownership percentages.
The CASS parent received Rp258,093 million of dividends up from its subsidiaries in FY2025 [14] — almost exactly what the Singapore partners drew in the same year. Both co-owners of the operating assets were paid roughly Rp256–258 billion in cash. The difference is what happened next: SATS took its cash home, and the CASS parent kept its share, passing none of it to the public shareholders who sit one level above the assets.
A fee that comes off the top
The dividend split understates SATS's draw, because SATS is also paid before the profit is struck. JAS carries a management fee to SATS Ltd. that runs through operating expenses: Rp17,529 million in FY2025, up from Rp13,636 million in FY2024 and Rp12,329 million in FY2023 [15] [16]. The fee grew 29% in FY2025, faster than JAS's dividend in most years, and it is charged to the consolidated business — so the public shareholder funds 50.10% of it while SATS keeps 100% of it. SIAEC is paid similarly for operational certification on the maintenance side [17].
Sources: JAS dividends FY2023–FY2025, Notes 1c [18] [19]; SATS management fee, Note 27 [20] [21].
Adding it up, SATS drew roughly Rp247 billion of cash from CASS in FY2025 — Rp229.5 billion as its JAS dividend share plus the Rp17.5 billion fee — and the two Singapore partners together took about Rp273.5 billion. Against that, public shareholders received Rp0, as they had in each of the prior three years.
Cash to Singapore partners, FY2025 (Rp bn)
SATS management fee (Rp bn)
Parent dividend income (Rp bn)
Dividend to public holders (Rp bn)
Sources: FY2025 audited statements, Notes 1c, 27 and 36 [22] [23] [24]; public-holder dividend record per Capital Allocation.
SATS sits on both sides of the table
SATS did not walk away when EMTEK took control. When PT Roket Cipta Sentosa (EMTEK) bought its 51% stake in April 2024 and lifted it to 61% in April 2025, SATS sold a 10.1% "Cemerlang" block into that second step [25] — but it kept a 21.65% holding in the listed parent, through SATS Investment (II) Pte. Ltd., alongside its operating-level stakes [26]. Earlier chapters described SATS as having "exited the parent"; more precisely, it reduced its parent stake but remains the second-largest shareholder, behind only EMTEK.
Source: FY2025 audited statements, Note 19 Share Capital, composition as of the FY2025 report [27].
This is why the missing parent dividend hurts the public holder more than it hurts SATS. SATS already collects its return where the cash is generated — a 49.8% share of JAS's dividend, in cash, every year. Whether or not the listed parent ever pays, SATS has been paid. The public shareholder, holding 11.70% of a parent that owns 50.10% of the cash machine, is paid only if EMTEK chooses to distribute. And if EMTEK ever does, that dividend flows 61.0% to itself and 21.65% to SATS, with only 11.70% reaching the public float — so even the upside case is one the public minority shares from the back of the line. The half-ownership that earlier chapters measured as an accounting leakage is, in cash terms, a claim SATS can exercise and the public cannot.
Rent on a network, or a toll on the minority
The fair reading is not that SATS is extracting value it did not create. JAS earns a 29% operating margin partly because it runs inside SATS's global system. The FY2025 report shows JAS stations collecting awards from within the SATS network — Service Excellence at the SATS Gateway Services APAC CEO awards and the SATS Global PCEO Awards [28] — and JAS and JAE jointly serving new blue-chip routes such as Etihad's Abu Dhabi–Medan launch, with JAE providing technical certification support [29]. The management fee buys brand, systems, technical support and access to SATS's international carrier relationships — inputs that plausibly underpin the very margin the moat chapter documented (Ground Handling Moat). On that view the fee and the dividend split are rent on genuine capability, priced at 0.76% of consolidated liabilities and disclosed as related-party transactions.
The two co-owners are also exposed to the same cycle, from opposite ends. SATS told its own investors that Middle East conflict "impacts our JVs" and their associate earnings [30] — the same airspace disruption CASS flagged as its largest post-COVID capacity cut. And SATS itself is a cash-hungry parent: it is paying down debt and raised its own dividend payout 40% on the year [31], which is precisely why it wants JAS's cash upstreamed to Singapore rather than retained in Jakarta. SATS's incentive is to keep the JAS dividend flowing; that incentive happens to align with the public minority, who also want the crown jewel's cash distributed rather than hoarded.
On balance, the half-owned structure is not a passive accounting quirk but a live cash arrangement in which SATS is paid first, in cash, at the asset — and the public minority is paid last, if at all, at the listco. The strongest fact against treating that as a grievance is that SATS's presence is part of why the asset is worth owning at all, and that SATS's appetite for cash pulls in the same direction the minority wants. What would change the read is a maiden parent dividend, which would finally give the public holder the cash access SATS has always had, or evidence that the management fee and JV terms drift beyond arm's length as EMTEK and SATS renegotiate a relationship whose controlling partner has changed.
Capital Allocation
For four straight years the CASS parent has declared no dividend to its own shareholders, even as it collected rising cash dividends from its half-owned subsidiaries and let group cash build to Rp1.77 trillion. The money is not trapped downstream — the parent received Rp258 billion of subsidiary dividends in FY2025 and kept all of it. EMTEK, in control since 2024, has consolidated ownership and rebuilt the board but signalled nothing on returns; the one visible use of the idle cash is a Rp200 billion placement into a state fund at a 2% coupon.
What the public holder has received
CASS states it plainly in successive annual reports: "In 2025 and 2024, the Company decided not to distribute dividends to shareholders" [1], and the same for 2024 and 2023 [2]. Over those same four years the group's operating subsidiaries paid roughly Rp635 billion of cash dividends to their minority partners — chiefly SATS at the JAS ground-handling level: Rp113.0 billion (2022), Rp148.9 billion (2023) [3], Rp117.4 billion (2024) and Rp256.0 billion (2025) [4].
The statement of changes in equity confirms where those payments land: the "cash dividend" line reduces only the non-controlling-interest column — Rp117,412 million in FY2024 and Rp256,018 million in FY2025 — while the parent's own retained earnings rise untouched, from Rp990,538 million to Rp1,441,290 million [5]. The minority partner at the operating company is paid in cash every year; the public shareholder at the parent is not.
Source: FY2025 Annual Report, Dividends and Dividend Policy [6]; FY2024 Annual Report, Dividends and Dividend Policy [7].
The cash reaches the parent, then stops
A reader could reasonably assume the cash is stranded inside a subsidiary the parent only half-owns. The parent-only financial statements say otherwise. In FY2025 the parent booked Rp258.1 billion of dividend income up from its subsidiaries — more than double the Rp118.6 billion of a year earlier — plus Rp42.7 billion of interest [8]. It ended the year with Rp639.2 billion of cash of its own [9], Rp891.6 billion of distributable (unappropriated) retained earnings, and almost no debt — total parent liabilities were Rp21.8 billion [10]. The cash arrived at the parent, and the parent chose to keep it.
The operating level is close to even-handed. In FY2025 the subsidiaries distributed roughly Rp514 billion of dividends in total — Rp256 billion to non-controlling interests and Rp258 billion up to the parent — a near-even split consistent with the roughly 50/50 ownership of JAS [11][12]. Cash leaves the subsidiaries to both owners in step; the asymmetry appears one level up, where the parent retains the public shareholder's share rather than passing it on.
Source: Note 36, Financial Information of Parent Entity, FY2025 audited financial statements [13][14][15].
The cash balance and what it earns
Group cash and equivalents reached Rp1,774.1 billion at end-2025, up from Rp1,480.1 billion a year earlier and equal to about 55% of total assets [16]. Against Rp94.2 billion of debt, net cash was roughly Rp1,680 billion — about 43% of the company's Rp3.94 trillion market value. On a stock that pays its public holders nothing, close to half the market capitalisation is idle cash.
Group cash (Rp tn)
Net cash (Rp tn)
Parent-only cash (Rp bn)
Net cash / market cap
Source: Note 4, Cash and Cash Equivalents [17]; net cash and market-value ratio derived from reported financials and the 30 July 2026 share price.
How the balance is held is reassuring on one axis and less so on another. The balance sits in ordinary time deposits (Rp1,453.6 billion) and bank accounts spread across arm's-length banks — BNI, BTN, Mandiri, CIMB Niaga, BCA and Standard Chartered — earning 3.50%–5.25% on Rupiah and 4.00%–4.25% on dollars [18]. There is no sign the cash is being routed to a bank affiliated with the controller — a genuine mitigant given how often minority value leaks that way in the region.
One deployment reads less comfortably. On 21 October 2025 the group subscribed Rp200 billion — about 11% of its cash — to a privately-placed, five-to-seven-year debt instrument issued by PT Danantara Investment Management, the state's strategic-investment vehicle, at a fixed coupon of 2% [19]. That 2% is below what the same balance sheet earns on plain bank deposits and well under Indonesian inflation, and the money is now locked up for years rather than available for distribution. It is small against the Rp1.77 trillion cash balance, but it is the first visible decision about the idle cash under the new owner, and it moved money toward a government fund rather than toward shareholders.
Who is deciding, and a precedent worth knowing
EMTEK — the Indonesian media and internet group — took control through PT Roket Cipta Sentosa, lifting its stake to 61% by April 2025 [20] and replacing the top of the board [21] before renaming the company Cahaya from Cardig and divesting the JATC training subsidiary in July 2025 [22]. What it has not done is set out any policy for returning cash to the roughly 12% public float.
How a CASS controller uses group cash is not hypothetical. The FY2025 accounts still carry Rp385.4 billion of impaired "other receivables" owed by the previous owners' vehicles — PT Dinamika Raya Swarna (Rp197.2 billion) and DRS Capital (Rp188.2 billion) — loans the group extended to affiliated parties and has now provided against in full [23]. In July 2025 it assigned a further related receivable, from Cardig Asset Management, to a third party for a nominal Rp1,000 [24]. The prior control group extracted value through affiliate lending that did not come back; that history raises, rather than settles, the question of what the current control group will do with a far larger and more liquid cash balance.
What would change the read
The capacity for a first dividend is not in doubt. Parent-only cash of Rp639 billion and distributable earnings of Rp891.6 billion could fund a substantial maiden payout without touching the operating businesses or the net-cash position [25][26]. EMTEK has held full 61% control only since April 2025, so a first dividend has not yet had an annual cycle to appear, and CASS's dividend policy is discretionary under its articles [27].
The read here — that the public minority's cash return has so far been nil while the balance compounds — would change with a declared parent dividend at the next annual meeting, or a buyback of the thin float. It would harden the other way with further below-market placements like the Danantara subscription, or a return to affiliate lending. For a stock trading at roughly eight times earnings with 43% of its market value sitting in cash, the outcome for public shareholders is most sensitive to whether the parent ever distributes that cash.
Reading the Controller
The bull and bear cases for CASS agree on the business and part company on whether its EMTEK-controlled parent ever distributes the cash the public float cannot otherwise reach. That decision cannot be extracted from a filing, but the controller can be read three ways: who EMTEK is and how it treats its own shareholders, whom it installed to run CASS, and what it has done with the first idle cash under its control. All three point the same way — cash managed as a strategic group resource, with a maiden minority dividend the exception rather than the base case.
Who now owns CASS
Control of CASS sits with Indonesia's EMTEK group, which holds 61% through PT Roket Cipta Sentosa, a subsidiary of PT Elang Mahkota Teknologi Tbk ("EMTEK Group"); the step-by-step acquisition that built that stake is set out in Capital Allocation [1]. The consolidated financial statements name Roket Cipta Sentosa as the parent and Elang Mahkota Teknologi as the ultimate parent [2].
EMTEK control
SATS stake
Public float
Source: FY2025 Annual Report, corporate history [3]; Q4 FY2024 audited statements, Note 1 [4].
EMTEK is not an aviation company. It is a Jakarta-listed conglomerate built by the Sariaatmadja family around free-to-air television (SCTV, Indosiar), then extended through the 2010s into digital ventures (the e-commerce platform Bukalapak and the payments app DANA), healthcare and banking, per EMTEK's public corporate disclosures. CASS is a diversification into cash-generative airport services — the kind of steady, profitable asset that sits oddly alongside a portfolio whose digital arms have historically consumed capital rather than returned it. That contrast is the starting point for reading intent: a controller's behavior at a new asset tends to follow its behavior everywhere else.
A controller that redeploys before it distributes
EMTEK's treatment of its own shareholders is a matter of public record, and the pattern is consistent: it distributes when it is not deploying, and it deploys aggressively. According to EMTEK's investor-relations dividend disclosures, the parent paid a cash dividend every year from 2011 through 2017, then paid nothing at all for four consecutive years — 2018, 2019, 2020 and 2021 — the stretch in which it was funding Bukalapak, DANA, healthcare and its entry into banking. Dividends resumed only in modest form thereafter.
Source: EMTEK (Elang Mahkota Teknologi) investor-relations dividend disclosures, dividend history 2011–2025 (issuer's own record; no corpus PDF page).
The read this supports is not that EMTEK never pays — it does, when its own capital needs are light. It is that EMTEK ranks reinvestment and portfolio-building ahead of distribution, and will let a cash balance sit dormant rather than return it while it has uses in mind. Applied to CASS, whose parent ended FY2025 with the capacity to pay, that DNA argues for retention as the default.
The bench EMTEK installed
Who EMTEK installed to run the asset points the same way. EMTEK did not import an aviation operator; it installed its own people and gave the board institutional and political reach rather than industry depth.
| Appointee | Role at CASS | Background and signal |
|---|---|---|
| Andya Daniswara | President Director (CEO), since 2024 | A career EMTEK executive — long-serving in EMTEK business development and previously involved in its DANA and TIX ID ventures — installed by the EMTEK-era EGMS and disclosed as affiliated with Roket Cipta Sentosa. A portfolio operator, not a ground-handling veteran. |
| Sunarsih | Director, since 2024 | A legal specialist who was previously corporate-legal counsel within EMTEK's Surya Citra Media (SCTV/Indosiar). Group legal continuity placed on the CASS board. |
| Djoko Suyanto | President Commissioner (chair), elevated 2024 | Retired Air Chief Marshal and former Coordinating Minister for Political, Legal and Security Affairs; concurrently President Commissioner of Chandra Asri. Political and institutional heft rather than sector expertise. |
Sources: FY2025 Annual Report, Board of Directors profile [5] and Board of Commissioners profile [6]; corporate-history and appointment detail [7]; career detail from the company's board and management disclosures.
The CEO is disclosed as affiliated with the controlling shareholder and was appointed by the extraordinary meeting that followed the takeover [8]. A board composed of a group business-development executive, a group lawyer, and a politically connected chair is built to manage CASS as one holding in a portfolio and to protect its standing with the state bodies that grant its airport concessions — not to run an aviation business day-to-day, and not, on its face, to champion the minority's claim on the cash.
What the cash has actually done
The first visible decision on CASS's idle cash under EMTEK was not a return to shareholders. On 21 October 2025 the group placed Rp200,000 million into privately-placed, fixed-rate debt issued by PT Danantara Investment Management — the investment arm of Indonesia's new sovereign wealth vehicle, launched in 2025 under President Prabowo Subianto to consolidate state assets [9]. The coupon sits below what CASS earns on its own Rupiah bank deposits [10], with the coupon-versus-deposit comparison detailed in Capital Allocation; the annual report books the placement among the year's investing outflows [11].
Placed in Danantara debt (Rp m)
Danantara coupon
Parent distributable earnings (Rp m)
Sources: Q4 FY2025 audited statements, long-term debt-investment note [12]; FY2025 Annual Report, dividends and dividend policy [13].
Three facts sit together. The parent ended FY2025 with about Rp891,591 million of distributable retained earnings and negligible debt — ample capacity for a first dividend [14]. The company nonetheless recorded, for both 2025 and 2024, that it "decided not to distribute dividends to shareholders," even as its subsidiaries paid roughly Rp256,018 million of cash dividends — most of it to the Singaporean partner SATS through the non-controlling-interest line [15]. And the one active deployment of surplus cash channeled it into a below-market, five-to-seven-year, state-linked instrument. The capital-allocation mechanics behind these figures are set out in Capital Allocation; read as evidence of intent, they describe a controller putting the balance sheet to work on strategic and institutional relationships rather than on the minority's return.
Alongside the placement, EMTEK's first full year of control produced portfolio housekeeping consistent with a group owner — a rename, a domicile move and a divestment, recapped in Capital Allocation [16]. Tidying the portfolio, not distributing from it, has been the pattern to date.
The forward read
The evidence points to retention as EMTEK's base case for CASS: a controller whose own history favors reinvestment over distribution, a board built for portfolio control and institutional reach, and a first cash decision that favored a state-aligned placement over a payout. On this read, the value the minority could capture from the cash pile stays optionality rather than income, and the discount to the parent's distributable capacity persists until something forces the question.
The strongest facts against it are real. EMTEK does resume dividends once its capital needs ease, and it has done so at its own listing since 2022; CASS is far more cash-generative and far less capital-hungry than the digital ventures that absorbed EMTEK's cash in 2018–2021, so the case for hoarding is weaker here than it was there. A token maiden dividend would also be cheap goodwill with the 12% minority and cost the controller little. And a dividend, if it came, would flow first and largest to EMTEK itself — so the controller's own interest is not permanently opposed to a distribution, merely unhurried about it.
Two developments would change the read in opposite directions. A first cash dividend declared at an annual meeting — the decision timeline is laid out in Scenarios and Watch-List — would confirm that EMTEK intends CASS to fund its own shareholders and would narrow the discount that Valuation quantifies. The reverse signal matters more: any redeployment of CASS's cash toward EMTEK-affiliated ventures or further state-directed placements would confirm that the balance sheet is being managed for the group and the state, not for the listed company's owners.
What the Price Offers
CASS trades at 8.6 times FY2025 earnings, and that multiple already carries the report's central tension. It is struck on the Rp457bn that reaches CASS shareholders, not the Rp840bn the group earns [1] [2]. Roughly 43% of the market value is cash the controller has never distributed [3]. Stripped of that cash, the operating franchise sits at roughly five-to-eight times look-through earnings. The price is low; whether it is cheap turns on a payout that has not come.
Market Cap (Rp bn)
Trailing P/E (parent EPS)
Group Net Cash / Mkt Cap
Parent-Level Cash / Mkt Cap
Sources: market data as of 30 July 2026 (Rp1,890 close, 2,086,950,000 shares); FY2025 profit attribution and EPS [4]; cash and deposit note [5]; parent-only cash [6].
The multiple is already minority-adjusted
The first thing to pin down about CASS's valuation is which earnings the price is measured against. The group reported Rp839,517m of net profit in FY2025, but Rp382,293m of that — 45.5% — belongs to the non-controlling partners in the half-owned subsidiaries, chiefly SATS. Only Rp457,224m is attributable to CASS's own shareholders, and that is the figure behind the reported basic EPS of Rp219 [7] [8].
That distinction is the difference between two very different-looking multiples. At Rp1,890, the Rp3.94tn market cap divided by group net profit gives 4.7 times — a number that would flag as unusually cheap on a quick screen. Divided by the profit that actually reaches shareholders, it is 8.6 times. The consolidation that puts 100% of a half-owned handler on the income statement makes the group look larger than the slice an outside investor owns; the honest multiple corrects for that.
Sources: derived from the Rp1,890 close (30 July 2026) and FY2025 attributable profit of Rp457,224m / group profit of Rp839,517m [9] [10]; ex-cash lenses per the table below.
The 8.6-times figure is not, in isolation, expensive for what sits underneath it: a franchise earning a 29.5% operating margin and a ~30% return on the equity attributable to the parent, with attributable EPS that has compounded from Rp16 in FY2021 to Rp219 in FY2025 [11]. That growth is most of why the stock re-rated after EMTEK arrived; it is also the part of the case most exposed to a traffic cycle, and the first quarter of 2026 gave a hint of that (below).
Source: FY2025 financial statements, basic EPS attributable to owners of the parent (with FY2021–FY2024 comparatives) [12].
Almost half the market value is cash — but not all of it is the listco's
CASS ended FY2025 with Rp1,774,110m of cash and equivalents against about Rp94bn of lease liabilities, for net cash near Rp1,680bn [13]. Against a Rp3.94tn market cap, that is 43% of the equity value held in cash — a striking figure, and the reason the operating business looks so cheap once it is stripped out.
There is a catch that follows directly from the ownership structure. Most of that cash sits inside the subsidiaries, where the same 45.5% minority claim applies. The listed parent's own balance sheet — disclosed separately in Note 36 — held Rp639,161m of cash, plus a Rp140,355m holding in the Danantara debt instrument, against only Rp21,790m of liabilities [14]. So of the group pile, the portion that unambiguously belongs to CASS shareholders at the top company is about Rp639bn — 16% of the market cap, not 43%. The rest is a look-through claim on cash the parent shares with SATS at the subsidiary level, most of it in the 50.1%-owned handler JAS.
Sources: group cash and net of lease liabilities [15]; parent-level cash from Note 36 [16].
One more feature of the parent balance sheet matters for the marks below. It carries its stakes in JAS, JAE, PMAD and the other operating units at cost — Rp383,618m in total [17]. Those units sent Rp258bn of dividends up to the parent in FY2025 alone, so their cost carrying value tells you nothing about their worth. Parent book value per share of about Rp738 (and a 2.6-times price-to-book) is therefore not a meaningful floor here — the assets that matter are held below cost, and the equity is cash-heavy. Book value is the wrong lens for this company; earnings and cash are the right ones.
Ex-cash, the operating franchise is genuinely cheap
Because so much of the balance sheet is cash, the operating franchise — the ground-handling business and its sister units — commands only part of the Rp3.94tn. How cheap that part looks depends on how much of the group cash is credited to the listco, so the honest answer is a range rather than a point.
At one end, crediting only the Rp639bn of cash that sits at the parent and removing the parent's own interest income of about Rp40bn from attributable earnings puts enterprise value at about Rp3,305bn against roughly Rp417bn of operating earnings, or 7.9 times. At the other end, crediting the full Rp1,680bn of group net cash and removing the parent's ~Rp38bn share of group net interest income lowers enterprise value to about Rp2,264bn against roughly Rp419bn, or 5.4 times.
Source: derived from FY2025 attributable profit of Rp457,224m, group finance income of Rp86,209m and finance cost of Rp15,574m, and parent-level cash of Rp639bn / group net cash of Rp1,680bn [18] [19].
Either way the operating franchise trades in the mid-single-digit to high-single-digit range of look-through earnings — cheap for a business of this margin and growth. The reason the market withholds full credit is not hard to find, and it is the same reason the whole report keeps returning to: the cash yields little and reaches the public holder as nothing. The group's Rupiah deposits earn 3.50%–5.25%, and the first Rp200bn deployed under the new owner went into a five-to-seven-year Danantara instrument at a 2% coupon — below even the deposit rate [20] [21]. A pile that earns a real return below inflation and is never paid out is worth less to a minority holder than its face value, and the market prices it that way. The ex-cash multiple is not a free lunch; it is the market declining to hand full value to cash it cannot reach.
What a payout would be worth
The mechanical flip side is that the discount would close quickly if a distribution ever arrived. The listed parent alone ended FY2025 with Rp891,591m of distributable retained earnings and was effectively debt-free [22]. Distributed in full, that is Rp427 per share — 23% of the current price returned in a single stroke. Short of that, ordinary payout ratios against FY2025's Rp219 of attributable EPS translate into yields a cash-rich, no-debt company could sustain without strain.
Source: illustrative, derived from FY2025 attributable EPS of Rp219 and the Rp1,890 close; the company paid public shareholders nothing in FY2022–FY2025 [23] [24].
The gap between the left bar and the others is the option embedded in the price. The company's stated dividend policy is discretionary — payments are weighed against its capital-structure limits with creditors, debt covenants, capital-expenditure needs and internal cash requirements, with no target ratio [25]. The subsidiaries already distribute freely to their owners: JAS and the others paid Rp256,018m to their SATS-side minorities in FY2025, matched by a near-identical sum upstreamed to the parent [26] [27]. The cash is not trapped by mechanics; the parent simply keeps its share. The bull case is that this is timing — EMTEK held full 61% control only from April 2025, and a maiden dividend has not yet had an annual cycle to appear. The bear case is that a controller who has just parked idle cash at a 2% coupon is signalling a use for it other than distribution.
The last arm's-length mark
There is one dated, arm's-length reference point for what CASS is worth, and it sits well below today's price. In April 2024 EMTEK's vehicle, PT Roket Cipta Sentosa, bought 51% of CASS for about Rp872.76bn — roughly Rp820 per share — and followed with a mandatory tender at Rp883, later lifting its stake to 61% by taking a further 10% from SATS's side in April 2025 (per the exchange disclosures at the time) [28]. At Rp1,890, the stock is about 2.1 times the price a strategic, control-seeking buyer paid barely two years ago.
Some of that gap is earned: attributable EPS has grown from Rp100 in FY2023 (the year before the deal) to Rp219, so EMTEK bought at roughly 5 times forward earnings and the business has since delivered. But the re-rating means the deep-value entry is spent — an investor today is paying up from the last independent mark, not alongside it. The recent tape reflects the tension: the shares ran to about Rp2,550 earlier in 2026 and have since drifted back near Rp1,835–1,890, and the first quarter of 2026 showed attributable EPS of about Rp43 against Rp45 a year earlier — a mild decline, the first interruption to the compounding, consistent with the traffic and airspace-capacity risk flagged in Ground Handling Moat (per interim market data; the corpus ends at FY2025).
Cheap compounder or value trap
CASS's operating stub looks cheap — an 8.6x attributable P/E (not the 4.7x a group-basis screen implies) with ~43% of market cap in net cash — and the parent holds Rp891,591 million of distributable retained earnings (Rp427/share, 23% of the Rp1,890 price) that could fund a 3.5-5.8% maiden dividend, but any such dividend reaches the 11.7% public float only one-ninth of the way while 61% goes to EMTEK and 21.65% to SATS, and the controller has paid public shareholders nothing for four straight years.
Put together, the price offers a specific, testable proposition. Roughly 16% of the market cap is cash the listed parent controls outright, a further slice is a look-through claim on subsidiary cash shared with SATS, and the operating franchise behind it trades at five-to-eight times look-through earnings — inexpensive for a 29%-margin, ~30%-return business. The evidence points to genuine underlying cheapness on the operating stub.
What keeps it from being simply cheap is that most of the value only converts to a minority holder's return through a distribution the controller has withheld for four years and shows no committed intention to start. If a maiden parent dividend appears — the natural place to watch is the AGM following the FY2025 accounts, with the next results due in August 2026 — the cash re-rates from a discounted, low-yielding asset toward face value and the stub's cheapness is realised. If it does not, an investor owns a well-run half-share of an airport handler wrapped around a large, low-returning cash balance that accrues, as it has, to book value rather than to cash in hand. The read here leans toward cheap-but-gated: the discount is real and the trigger is identifiable, but the trigger has a poor track record, and the one thing that would change the read — an initiated payout — is the one thing the controller has so far declined to give.
Bear Case
CASS's four-year earnings recovery has run alongside rising air traffic, and its cost base is mostly fixed. The last real traffic shock — COVID — cut revenue 44% but operating profit 93%, into a group loss [1]. The offset is a net-cash balance sheet that makes a repeat a threat to earnings, not to survival. And the first soft quarter — Q1 2026 — showed the half-owned structure turning a flat group into a decline for the public holders whose share of the cash this report has followed throughout.
Operating leverage cuts both ways
The franchise's best feature in an upswing is its worst in a downturn. Roughly half of the aviation cost base is salaries, depreciation, rent and security — costs that do not fall with volume — so profit is geared to traffic in both directions. COVID is the model's one realized stress test, and it is unambiguous: between FY2019 and FY2020, group revenue fell 44.3% (Rp2,194,306 million to Rp1,222,921 million) while operating profit fell 93.3% (Rp435,326 million to Rp29,033 million), collapsing the operating margin from 19.8% to 2.4% [2]. At the bottom line the group booked a Rp60,425 million loss for FY2020 [3].
Source: FY2021 Annual Report, Financial Highlights and Consolidated Statement of Profit or Loss (FY2019–FY2020) [4]; FY2025 audited results, Consolidated Statement of Profit or Loss (FY2021–FY2025) [5].
The shape of the recovery matters as much as its speed. Operating profit did not merely rebound; it compounded from a near-zero FY2020 base back through Rp239,602 million (FY2021) to Rp959,198 million (FY2025) [6]. That is the operating leverage working in the company's favour on the way up. The same gearing means a traffic shock of the COVID magnitude would take the operating line most of the way back to zero — and this time from a higher, more valuable base.
A cost base that does not flex
Where the leverage lives is visible in the FY2025 aviation cost stack. Of Rp2,146,643 million of aviation operating expense, salaries and employee benefits were the largest line at Rp732,209 million — 34% of the total, and up 13.8% on FY2024's Rp643,223 million [7]. Add depreciation (Rp151,891 million), rental (Rp71,131 million) and security (Rp77,042 million), and roughly Rp1,032,000 million — about 48% of the aviation cost base — sits in lines that a downturn does not switch off [8].
Source: FY2025 audited results, Note 24 Operating Expenses (aviation) [9].
The second-largest line is the cargo-sharing toll to the state airport operator — Rp434,106 million, 20% of aviation cost [10]. It scales with cargo revenue, so it flexes down in a downturn — but it is a contractual claim by the landlord ahead of profit, examined in Ground Handling Moat, and it has grown every year. Labour is the more telling line: even before any downturn, the wage bill is rising faster than most of the business, and Indonesian severance rules make it slow to cut. In the first quarter of 2026, cash paid to employees rose 17.2% year on year (Rp326,290 million against Rp278,422 million) while revenue grew 7.2% [11]. Wage inflation running at more than twice revenue growth is a margin headwind independent of the traffic cycle.
The first soft quarter, and who absorbs it
Q1 2026 is the first interruption to the compounding, and it is more revealing than the headline suggests. Group revenue grew 7.2% (Rp779,710 million against Rp727,047 million), but operating expense grew 9.4%, so operating profit rose just 1.8% and profit for the period was essentially flat, up 0.3% [12]. Costs growing ahead of revenue on a single quarter is not yet a trend, but it is the exact signature a fixed-cost business shows when volume growth slows.
The distribution of that flat quarter is the part that connects to this report's central question. Group profit barely moved, but the split moved against the public holders: profit attributable to the owners of the parent fell 4.3% (Rp89,956 million against Rp93,957 million), while the non-controlling interests' share rose 5.5% (Rp87,568 million against Rp82,964 million) [13]. Basic earnings per share slipped to Rp43 from Rp45 [14].
Source: Q1 FY2026 interim results, Interim Statement of Profit or Loss and profit attribution [15] [16].
The mechanism is structural, not a one-off. The parent owners' earnings lean on two pieces: their roughly half-share of the operating businesses, and the finance income on the group's cash pile, which belongs to them in full. In Q1 2026 that finance income fell to Rp19,986 million from Rp20,994 million, so the wholly-owned cushion was flat-to-down while the marginal operating profit that did grow was shared with the Singapore partners [17]. The asymmetry is structural: in a softening quarter, the public holder's slice can fall while the group's is flat and the partners' rises. Cyclicality does not land evenly across this cap table.
The 2028 concession renewal
The cyclical risk sits on top of a structural date. All of JAS's airport access rests on business-concession agreements with the state operator, PT Angkasa Pura Indonesia, whose terms — including extensions — run one to three years, so that the agreements terminate in 2028 [18]. The cargo-terminal cooperation agreements carry the same 2028 horizon [19]. The full renewal setup — a landlord that also owns JAS's principal rival, and a toll that has risen every year — is laid out in Ground Handling Moat; the point for the downside case is narrower. Almost the entire earnings base the market capitalises comes up for re-tender inside three years, and the ex-cash operating multiple discussed in Valuation implicitly assumes those concessions renew on terms no worse than today's. Forty years of continuous access argues they will. But it is a genuine step-change risk that a good year of results does nothing to retire.
Management's own framing for FY2026 is unusually candid on the external side. The board describes the outlook as "remaining open" but adds that growth "cannot be separated from rising external risks stemming from global geopolitical uncertainty, which may disrupt air connectivity, put pressure on airline customers' cost structures, and narrow the room for business development" [20]. For a handler whose earnings gear to international flight volumes at Soekarno-Hatta and Bali, airspace disruption and airline cost pressure are not abstract — they are the channels through which a downturn would actually arrive.
What limits the downside
The reason this is a bear case and not a solvency case is the balance sheet. The group carries roughly Rp1,680,000 million of net cash — about 43% of its market value, quantified in Valuation — and its FY2025 finance cost was just Rp15,574 million against Rp959,198 million of operating profit [21]. The pre-pandemic company was more leveraged: in FY2020 it paid Rp41,335 million of finance cost while operating profit had collapsed to Rp29,033 million — a debt load that turned a bad year worse [22]. Today's net-cash position means a COVID-scale traffic shock would compress earnings hard but would not put the enterprise at risk, and would leave the cash pile intact to fund a recovery.
COVID Revenue Drop (FY19 to FY20)
COVID Operating-Profit Drop
Fixed Share of Aviation Cost
Source: derived from FY2021 Annual Report [23] and FY2025 Note 24 [24].
Three things would change this read, and each is checkable in a filing rather than a forecast. First, the FY2026 quarters: if the Q1 pattern of costs outgrowing revenue persists into Q2 and Q3, the flat-quarter signal becomes a margin inflection; if operating profit re-accelerates, it was a wage-timing wobble. Second, any FY2027 disclosure on the Angkasa Pura renewals — tenor, toll rate, or a shift of volume toward the state-owned rival — would move the terminal-value assumption directly. Third, the profit split: a downturn in which the owners' attributable share falls faster than the group's, as it did in Q1 2026, would confirm the half-owned structure amplifies the downside for public holders — the same structure that, on the upside, has driven attributable profit from a FY2020 loss to Rp457,224 million in FY2025 [25]. No sell-side analyst currently publishes an earnings estimate for CASS, so these are the reader's own instruments, not consensus's.
CASS's operating stub looks cheap — an 8.6x attributable P/E (not the 4.7x a group-basis screen implies) with ~43% of market cap in net cash — and the parent holds Rp891,591 million of distributable retained earnings (Rp427/share, 23% of the Rp1,890 price) that could fund a 3.5-5.8% maiden dividend, but any such dividend reaches the 11.7% public float only one-ninth of the way while 61% goes to EMTEK and 21.65% to SATS, and the controller has paid public shareholders nothing for four straight years. [1] [2] [3]
The gap between those two multiples is the entire non-controlling slice: 45.5% of FY2025 group profit — Rp382,293m of Rp839,517m — accrues to the Singapore partners, so a group-basis screen that counts all of it reads 4.7x while the owner's share reads 8.6x [4]. Against that, a maiden dividend from the distributable balance would yield an illustrative 3.5% to 5.8% at today's price, set beside the 0% actually paid for four straight years.
The counter sits in the same economics. The 8.6x embeds no heroic growth: a 29.5%-operating-margin business [5] earning roughly 30% on the Rp1,539,489m of equity attributable to the parent [6], whose attributable EPS compounded from Rp16 in FY2021 to Rp219 in FY2025 (Valuation) [7]. On those economics the discount reads as an option the controller can close, not a permanent impairment — which is why this chapter sets out scenarios and a dated watch-list rather than a point estimate.
The setup, reconciled
The report has argued both halves of the same balance sheet. The two readings do not disagree about the business — both accept the margin and the net cash. They disagree about one thing: whether the controller distributes.
| The cheap-compounder reading | The value-trap reading |
|---|---|
| Operating margin 29.5%, above the 19.8% earned pre-COVID [8] | 45.5% of group profit — Rp382,293m of Rp839,517m — is the Singapore partners', not the public holder's [9] |
| Attributable EPS Rp219, roughly 30% return on parent equity of Rp1,539,489m [10] [11] | Four straight years of zero dividend to public shareholders while subsidiaries paid Rp256,018m of cash to their minority holders [12] |
| Group net cash ~Rp1,680bn, about 43% of the market cap; parent cash Rp639,161m, near debt-free [13] [14] | The first capital move under the new owner placed Rp200,000m of idle cash at a 2% coupon, below its own bank-deposit rate [15] |
| Rp891,591m of distributable retained earnings sit at the parent — enough for a maiden dividend without weakening the balance sheet [16] | A cost base roughly half fixed turned a 44% COVID revenue fall into a 93% operating-profit fall, and the moat stands on airport concessions all expiring in 2028 [17] [18] |
Synthesises The Business, Ground Handling Moat, Capital Allocation, Valuation, The SATS Partnership and Bear Case; each figure is cited to the FY2025 audited statements.
The distribution decision
The two readings agree on the business and differ only on whether the controller distributes — a decision that is not the market's to make. The parent has the cash and the distributable earnings; it has chosen to retain them. Two facts frame how much resolving that choice is worth.
First, the no-payout policy predates EMTEK: the zero-dividend streak began in FY2022, under the former owners, so it reads as an inherited habit of capital conservation as much as a new controller's design. EMTEK has held clean 61% control only since April 2025, and its first annual meeting covering a full year under that control has since passed with the payout unchanged; the balance sheet's capacity to pay is not in question, only the will.
Second, the remedy is diluted at the source. Any parent dividend is split 61.000% to EMTEK, 21.650% to SATS and only 11.696% to the public float [19]. SATS already draws its return in cash at the JAS asset every year, so the controller group feels less pressure to pay at the listco than the "capacity exists" framing alone implies. The public holder's return therefore depends on a distribution decision made by owners who do not need it.
The Valuation chapter quantifies what a maiden distribution would be worth: the full Rp891,591m distributable balance is about Rp427 per share, ~23% of the price, and ordinary payout ratios against FY2025 attributable EPS imply an illustrative 3.5–5.8% yield against the actual 0% [20].
Three ways it resolves
| Scenario | What must be true | What you would see | The return driver |
|---|---|---|---|
| A — Cash unlocked | EMTEK initiates a dividend (or buyback) from the Rp891,591m distributable balance; concessions renew; traffic holds | A maiden distribution; a 3.5–5.8% yield appears; the ~43%-of-cap cash discount begins to close | Re-rating of the operating stub toward peers, plus a yield |
| B — Gated compounder | No payout, but attributable EPS keeps grinding higher and cash keeps building at the parent | The status quo: zero yield, a rising cash pile, the stock tracking earnings at ~8–9x | Attributable EPS growth only; the cash optionality stays unrealised |
| C — Downside | A traffic or airspace shock hits the ~half-fixed cost base, and/or the 2028 concessions renew on worse terms or shift volume to state-owned Gapura — with cash still undistributed | Operating profit falls faster than revenue (Q1 2026 was the preview); the ex-cash multiple compresses; no dividend to cushion it | Earnings and multiple contraction; net cash caps the loss at earnings, not solvency |
Scenario A is the only path that realises the cheapness the Valuation chapter measured; it needs an action, and that action has no precedent under EMTEK. Scenario B is what the base rate of the last four years implies — a genuinely good business compounding for owners who cannot touch the cash, which is why the market pays ~8.6x rather than the ~4.7x a naive group screen would suggest. Scenario C is not a solvency event: FY2025 finance cost was a rounding error against the cash pile, so even a COVID-scale shock would compress profit hard while leaving the balance sheet to fund the recovery — but in that state the half-owned structure works against the public holder, exactly as the Bear Case showed in Q1 2026, when group profit was flat but owners' attributable profit fell 4.3% to Rp89,956m while the partners' share rose 5.5% to Rp87,568m [21].
What to watch, and when
The company is not covered by sell-side analysts, so these events, not a consensus number, are the reader's instruments.
| When | Event | Why it moves the read |
|---|---|---|
| ~5 Aug 2026 | Q2 FY2026 results (date site-estimated) | Tests whether Q1's pattern — costs up 9.4% on revenue up 7.2%, owners' profit down while the partners' rose — persists or was wage-timing [22] |
| Spring 2027 | FY2026 Annual General Meeting | The dividend decision, the most informative event on the calendar. The most recent AGM (May 2026) passed with no maiden dividend, weakening the "timing, not policy" case [23] |
| 2026–2028 | Angkasa Pura concession renewals | All JAS ground-handling and cargo agreements terminate in 2028; watch tenor, toll rate, and any volume shift to the landlord's own Gapura [24] |
| Ongoing | EMTEK capital-allocation signals | Further Danantara-type placements, M&A, buybacks or related-party flows reveal whether idle cash is being worked for shareholders or parked [25] |
| Ongoing | Traffic and wage inflation | Middle East airspace disruption and Q1's 17%-plus wage growth are the two cycle-independent pressures on the volume-geared margin |
The shape of the bet
The asymmetry here is specific, and it is worth stating plainly once. The balance sheet caps the downside to earnings rather than solvency — a bad year compresses profit but the net cash funds the recovery. The upside, by contrast, needs an act, not just patience: a distribution that is entirely in EMTEK's gift and has, so far, no precedent under its ownership. That is why the same facts support two honest readings, and why the gap between them is closed not by a model but by a policy choice.
My own read, offered rather than pressed: at ~8.6x attributable earnings with 43% of the market cap in idle cash, the stock is priced as a value trap and sits one distribution decision away from being priced as a cheap compounder. What would move it, in either direction, is the first line of the watch-list above — the next results print and, more than anything, the next AGM. The reader now has the variables and the calendar; the judgement is theirs to make against them.